
A back-to-the-basics look at allocating capital efficiently
Key Observations
- A fixation on the direction of interest rates continues to drive prices in the short term, including in May. Rates moved lower, pushing rate-sensitive asset classes ahead of their peers.
- However, we take this opportunity to step back from the short-term focus on rates and discuss the findings of a recent long-term study on the efficient allocation of active and passive investing.
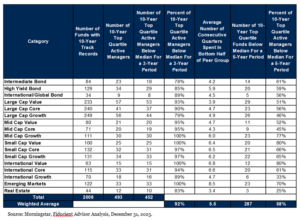
- Notably, 92% of 10-year top-quartile managers spent at least one 3-year period in the bottom half of their peer group, highlighting that success is not linear. We have also added nuance to our review of efficient allocation in markets most likely to be profitable to engage in active investing.
Market Recap
Rates, rates, and more rates. Perhaps an over-stylized narrative, but the market is clearly fixated on the direction of rates and the potential for a Fed rate cut. In May, rates moved lower, and there was a modest shift in Fed policy with a slowing of Quantitative Tightening, while maintaining the policy rate. As a result, more rate-sensitive sectors gained ground for the month, with longer-duration bonds outperforming cash, small caps in line with large caps, and REITs shining among real assets.
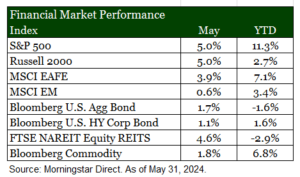
Despite these shifts, the S&P 500 managed to post a new high during the month, driven by continued exuberance around a few choice names that benefit from the intense focus on Artificial Intelligence. Despite the price increase, Q1 earnings season was favorable, leaving valuations relatively flat month-over-month at around 20x forward earnings. This remains at the upper end of the 20-year range, excluding the extraordinary spike seen around COVID due to the nuances of live prices and dated earnings. With 98% of companies reporting earnings, 78% have surprised to the upside, and earnings grew at a blended rate of 5.9%1.
Revisiting The Basics – Active & Passive
One of our research partners, Fiducient Advisors, since 2007, has delved deep into the data behind active and passive investing to aid in the decisions we make when constructing diversified portfolios. While this is not a new debate, the discussion has often turned dogmatic over the years. Some believe that passive investing is the only efficient approach, while others argue that active investing offers unique opportunities, leaving little room for middle ground. However, intellectual honesty allows us to consider both perspectives simultaneously.
Fiducient’s latest study embraces this nuanced approach to allocation, reaffirming that pragmatism and patience are the keys to success. Let’s begin with patience. After all, it is indeed a virtue. With respect to the selection of active managers, “top quartile” performance is often the goal. The most recent study, along with the seven preceding it, continued to confirm that the path to success is not linear. Often, top-quartile managers face adversity along the way. The latest 10-year review shows that 92% of top quartile managers over a ten-year period experience at least one three-year period where their results fall into the bottom half of their peer group. This trend has remained consistent over time, with figures ranging from the low 80s to the most recent study that found the number is now in the low 90s.
As the table illustrates, the cyclical path to success is not unique to any particular investment style, geography, or asset class. If you take away one thing from the analysis, let it be the importance of patience. Without it, investors risk falling prey to the trap of selling low and buying high—a true capital-destroying quagmire.
1Factset Earnings Insight, May 31, 2024.
Now, let’s talk pragmatism. Cognitive dissonance refers to the mental discomfort that comes from holding two seemingly conflicting beliefs at once. Yet in this discomfort, at least in this instance, underlies the opportunity in our opinion.
The most recent study underwent enhancements to add context to this discussion. Below, we graphically and mathematically attempt to illustrate a simple concept. The x-axis (horizontal-axis) represents the likelihood of outperforming the index—the higher the rank of the index, the lower the probability of selecting a manager who beats it. The y-axis (vertical-axis) represents the payoff, or lack thereof, in selecting a top-quartile manager.
To bring these ideas together, we like to use the analogy of a dartboard. The x-axis is the size of the dartboard: if we close our eyes and throw a dart, the larger the dartboard, the higher the probability of hitting it. The y-axis is the payoff for hitting the bullseye: if the payoff is low, we’re unlikely to invest time and energy in practicing and playing. If the payoff is high, it’s worth the effort.
In our view, investors are most efficient with their capital by allocating actively in asset classes in the upper right quadrant of this graphic, rather than the bottom left. Is it perfect? No, the truth often lies in shades of gray. For example, the high-yield fixed income index (bottom left) is effectively non-investable, and passive equivalents rarely match the index’s return, making the case for active. There are other examples where additional thought is required. That said, absent other information, following this rubric leads to a higher likelihood and magnitude of success.

Disclosures & Definitions
Investment advisory services offered through Thrivent Advisor Network, LLC., (herein referred to as “Thrivent”), a registered investment adviser. Clients will separately engage an unaffiliated broker-dealer or custodian to safeguard their investment advisory assets. Review the Thrivent Advisor Network Financial Planning and Consulting Services, Investment Management Services (Non-Wrap) and Wrap-Fee Program brochures (Form ADV Part 2A and 2A Appendix 1 brochures) for a full description of services, fees and expenses, available at Thriventadvisornetwork.com. Thrivent Advisor Network, LLC financial advisors may also be registered representatives of a broker-dealer to offer securities products.
The material presented includes information and opinions provided by a party not related to Thrivent Advisor Network. It has been obtained from sources deemed reliable; but no independent verification has been made, nor is its accuracy or completeness guaranteed. The opinions expressed may not necessarily represent those of Thrivent Advisor Network or its affiliates. They are provided solely for information purposes and are not to be construed as solicitations or offers to buy or sell any products, securities, or services. They also do not include all fees or expenses that may be incurred by investing in specific products. Past performance is no guarantee of future results. Investments will fluctuate and when redeemed may be worth more or less than when originally invested. You cannot invest directly in an index. The opinions expressed are subject to change as subsequent conditions vary. Thrivent Advisor Network and its affiliates accept no liability for loss or damage of any kind arising from the use of this information.
This material is provided for informational purposes only and is not solely intended to be relied upon as a forecast, research or investment advice, and is not a recommendation, offer or solicitation to buy or sell any securities or to adopt any investment strategy. The views and strategies described may not be suitable for all investors. They also do not include all fees or expenses that may be incurred by investing in specific products. Past performance is no guarantee of future results. Investments will fluctuate and when redeemed may be worth more or less than when originally invested. You cannot invest directly in an index. The opinions expressed are subject to change as subsequent conditions vary. Advisory services offered through Thrivent Advisor Network, LLC.
This communication may include forward looking statements. Specific forward-looking statements can be identified by the fact that they do not relate strictly to historical or current facts and include, without limitation, words such as “may,” “will,” “expects,” “believes,” “anticipates,” “plans,” “estimates,” “projects,” “targets,” “forecasts,” “seeks,” “could’” or the negative of such terms or other variations on such terms or comparable terminology. These statements are not guarantees of future performance and involve risks, uncertainties, assumptions and other factors that are difficult to predict and that could cause actual results to differ materially.
The statements in this letter are not historical facts and may be forward-looking statements. These forward-looking statements involve risks and uncertainties that could cause the outcome to be materially different. In addition, words such as “will,” “should,” “may,” “anticipate,” “believe,” “expect” and “intend” indicate a forward-looking statement, although not all forward-looking statements include these words.
The purpose of the report is to illustrate how accepted financial and estate planning principles may improve your current situation. The term “plan” or “planning,” when used within this report, does not imply that a recommendation has been made to implement one or more financial plans or make a particular investment. You should use this Report to help you focus on the factors that are most important to you. This Report does not provide legal, tax, or accounting advice. Before making decisions with legal, tax, or accounting ramifications, you should consult appropriate professionals for advice that is specific to your situation.
Advisory Persons of Thrivent provide advisory services under a “doing business as” name or may have their own legal business entities. However, advisory services are engaged exclusively through Thrivent Advisor Network, LLC, a registered investment adviser. Cedar Cove Wealth Partners and Thrivent Advisor Network, LLC are not affiliated companies. Information in this message is for the intended recipient[s] only. Please visit our website www.cedarcovewealth.com for important disclosures.
Securities offered through Purshe Kaplan Sterling Investments (“PKS”), Member FINRA/SIPC. PKS is headquartered at 80 State Street, Albany, NY 12207. PKS and Cedar Cove Wealth Partners are not affiliated companies.
Comparisons to any indices referenced herein are for illustrative purposes only and are not meant to imply that actual returns or volatility will be similar to the indices. Indices cannot be invested in directly. Unmanaged index returns assume reinvestment of any and all distributions and do not reflect our fees or expenses.
- The S&P 500 is a capitalization-weighted index designed to measure performance of the broad domestic economy through changes in the aggregate market value of 500 stocks representing all major industries.
- Nasdaq Composite Index includes all domestic and international common type stocks listed on the Nasdaq Stock Market.
- The S&P 500 Equal Weight Index (EWI) is the equal-weight version of the widely-used S&P 500. The index includes the same constituents as the capitalization weighted S&P 500, but each company in the S&P 500 EWI is allocated a fixed weight – or 0.2% of the index total at each quarterly rebalance.
- Russell 2000 consists of the 2,000 smallest U.S. companies in the Russell 3000 index.
- MSCI EAFE is an equity index which captures large and mid-cap representation across Developed Markets countries around the world, excluding the U.S. and Canada. The index covers approximately 85% of the free float-adjusted market capitalization in each country.
- MSCI Emerging Markets captures large and mid-cap representation across Emerging Markets countries. The index covers approximately 85% of the free-float adjusted market capitalization in each country.
- Bloomberg U.S. Aggregate Index covers the U.S. investment grade fixed rate bond market, with index components for government and corporate securities, mortgage pass-through securities, and asset-backed securities.
- Bloomberg U.S. Corporate High Yield Index covers the universe of fixed rate, non-investment grade debt. Eurobonds and debt issues from countries designated as emerging markets (sovereign rating of Baa1/BBB+/BBB+ and below using the middle of Moody’s, S&P, and Fitch) are excluded, but Canadian and global bonds (SEC registered) of issuers in non-EMG countries are included.
- FTSE NAREIT Equity REITs Index contains all Equity REITs not designed as Timber REITs or Infrastructure REITs.
- Bloomberg Commodity Index is calculated on an excess return basis and reflects commodity futures price movements. The index rebalances annually weighted 2/3 by trading volume and 1/3 by world production and weight-caps are applied at the commodity, sector and group level for diversification.
Material Risks
- Fixed Income securities are subject to interest rate risks, the risk of default and liquidity risk. U.S. investors exposed to non-U.S. fixed income may also be subject to currency risk and fluctuations.
- Cash may be subject to the loss of principal and over longer periods of time may lose purchasing power due to inflation.
- Domestic Equity can be volatile. The rise or fall in prices take place for a number of reasons including, but not limited to changes to underlying company conditions, sector or industry factors, or other macro events. These may happen quickly and unpredictably.
- International Equity can be volatile. The rise or fall in prices take place for a number of reasons including, but not limited to changes to underlying company conditions, sector or industry impacts, or other macro events. These may happen quickly and unpredictably. International equity allocations may also be impact by currency and/or country specific risks which may result in lower liquidity in some markets.
- Real Assets can be volatile and may include asset segments that may have greater volatility than investment in traditional equity securities. Such volatility could be influenced by a myriad of factors including, but not limited to overall market volatility, changes in interest rates, political and regulatory developments, or other exogenous events like weather or natural disaster.
- Private Real Estate involves higher risk and is suitable only for sophisticated investors. Real estate assets can be volatile and may include unique risks to the asset class like leverage and/or industry, sector or geographical concentration. Declines in real estate value may take place for a number of reasons including, but are not limited to economic conditions, change in condition of the underlying property or defaults by the borrow.
