
Small Cap Equities “Heat Up” In July
Falling rates and softer inflation contribute to a reversal in market leadership.

Market Considerations

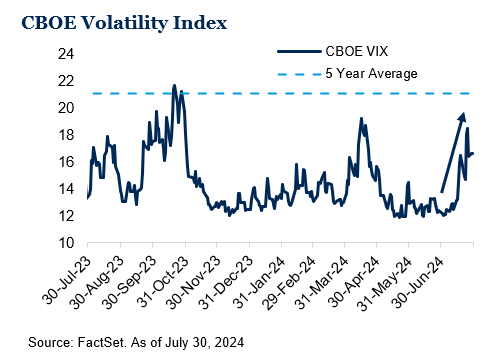
The second half of the year kicked off with no shortage of events. A favorable inflation print, weakening labor market data and political events surrounding the fall election all contributed to the spike in volatility during the month. Expectations of an interest rate cut from the Federal Reserve continue to underpin investor sentiment and we saw a significant shift in market leadership (which we explore below) following the CPI release mid-month. The concentrated large cap leadership from the first half of the year changed course with the S&P 500 Index producing a modest positive return, while U.S. small cap equities (Russell 2000 Index) had a standout month. International equities also moved higher with developed markets (MSCI EAFE Index) producing a modest positive return while emerging markets (MSCI EM Index) were roughly flat for the month. Increased rhetoric and uncertainty about foreign tariffs negatively impacted China, one of the weaker performing regions within emerging markets.
Fixed income markets fared well in the wake of lower interest rates and the Bloomberg U.S. Aggregate Bond Index moved into positive territory for 2024. U.S. CPI fell 0.1% seasonally adjusted in June, the first month-over-month decline since July 2022.[1] The Federal Reserve held the Fed Funds rate steady at 5.25%-5.5% during the July meeting but acknowledged the recent inflation data and a softer labor market in its statement. Other diversifying asset classes had mixed results during the month. Real estate has been nothing short of volatile this year and with the outlook for Fed cuts on the horizon, REITs also moved back into positive territory during July. On the other hand, commodities took a step back and were one of the few areas of the market in negative territory for the month. Supply-demand dynamics negatively impacted oil prices and industrial metals also had a weak month.
Market Leadership shifts in July
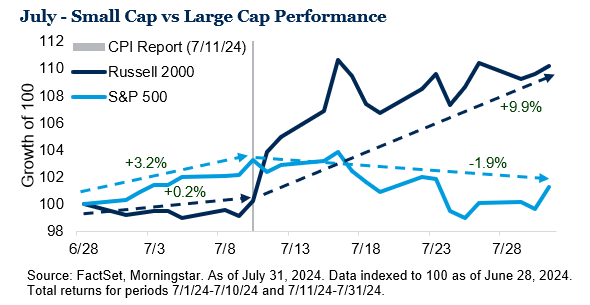
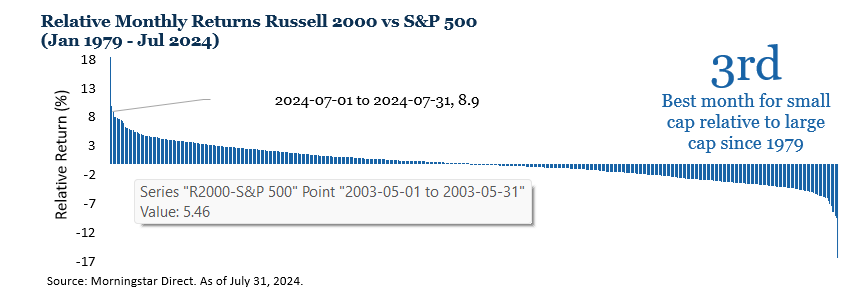
The U.S. inflation report on July 11 marked a turning point for the markets. While levels in headline inflation remain above the Fed’s 2% target, the trend lower over recent months has solidified investor expectations of a rate cut in September.[2] Further supporting investor sentiment was softer labor market data, however we’d be remiss to point out that, despite the recent unemployment rate uptick, the overall labor market has remained resilient thus far. Small cap equities surged in the back half of the month following the inflation print and ended the period 10.2% higher. Additionally, investors began to have questions regarding the monetization of AI and the enormous amount of capital expenditures many companies were making in the space, putting pressure on the “Magnificent 7” which fell 0.6% on average in July. While enthusiasm has softened somewhat on the AI craze from earlier in the year, investors will be keying in on the earnings releases in early August for several of these companies. This environment culminated with small cap having its third best month relative to large cap since 1979. Value stocks also shined relative to their growth equity counterparts, benefiting from many of the factors that helped small cap.
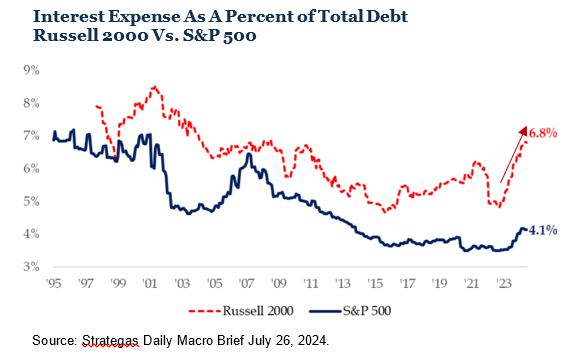
Lower interest rates and expectations for the Federal Reserve to start easing in September were the driving force behind the small cap rally, but let’s take a deeper look at one of the reasons why. Historically interest expense for small cap companies has been greater compared to larger cap companies. Intuitively this makes sense given they are “riskier” and therefore the cost of financing is more expensive. When the Federal Reserve began its tightening cycle in 2022, small caps were disproportionately impacted relative to large caps. Therefore, one could reasonably conclude that small caps may have a greater tailwind if interest rates start to decline.
Outlook
As we look forward it’s hard to call one month (or half a month for that matter) a trend, we believe there are multiple paths lower for the Fed to begin cutting rates. One important distinction to remember, as we highlighted in our July market commentary, Focus on Preparation, Not Prediction, is distinguishing between a hard and soft landing as the pace of rate cuts will vary depending on the Fed’s perspective. While we do not try to time the market, we recognize the potential opportunities outside of the handful of stocks that have driven much of the market gains over recent months and remain committed to diversified portfolio allocations as we prepare for markets ahead.
End Notes
[1] FactSet, BLS. As of July 11, 2024.
[2] CME FedWatch. As of July 31, 2024 there was an 88.1% probability of a 25 bps cut and an 11.8% probability of a 50 bps cut at the Federal Reserve September meeting.
Disclosures & Definitions
Investment advisory services offered through Thrivent Advisor Network, LLC., (herein referred to as “Thrivent”), a registered investment adviser. Clients will separately engage an unaffiliated broker-dealer or custodian to safeguard their investment advisory assets. Review the Thrivent Advisor Network Financial Planning and Consulting Services, Investment Management Services (Non-Wrap) and Wrap-Fee Program brochures (Form ADV Part 2A and 2A Appendix 1 brochures) for a full description of services, fees and expenses, available at Thriventadvisornetwork.com. Thrivent Advisor Network, LLC financial advisors may also be registered representatives of a broker-dealer to offer securities products.
The material presented includes information and opinions provided by a party not related to Thrivent Advisor Network. It has been obtained from sources deemed reliable; but no independent verification has been made, nor is its accuracy or completeness guaranteed. The opinions expressed may not necessarily represent those of Thrivent Advisor Network or its affiliates. They are provided solely for information purposes and are not to be construed as solicitations or offers to buy or sell any products, securities, or services. They also do not include all fees or expenses that may be incurred by investing in specific products. Past performance is no guarantee of future results. Investments will fluctuate and when redeemed may be worth more or less than when originally invested. You cannot invest directly in an index. The opinions expressed are subject to change as subsequent conditions vary. Thrivent Advisor Network and its affiliates accept no liability for loss or damage of any kind arising from the use of this information.
This material is provided for informational purposes only and is not solely intended to be relied upon as a forecast, research or investment advice, and is not a recommendation, offer or solicitation to buy or sell any securities or to adopt any investment strategy. The views and strategies described may not be suitable for all investors. They also do not include all fees or expenses that may be incurred by investing in specific products. Past performance is no guarantee of future results. Investments will fluctuate and when redeemed may be worth more or less than when originally invested. You cannot invest directly in an index. The opinions expressed are subject to change as subsequent conditions vary. Advisory services offered through Thrivent Advisor Network, LLC.
This communication may include forward looking statements. Specific forward-looking statements can be identified by the fact that they do not relate strictly to historical or current facts and include, without limitation, words such as “may,” “will,” “expects,” “believes,” “anticipates,” “plans,” “estimates,” “projects,” “targets,” “forecasts,” “seeks,” “could’” or the negative of such terms or other variations on such terms or comparable terminology. These statements are not guarantees of future performance and involve risks, uncertainties, assumptions and other factors that are difficult to predict and that could cause actual results to differ materially.
The statements in this letter are not historical facts and may be forward-looking statements. These forward-looking statements involve risks and uncertainties that could cause the outcome to be materially different. In addition, words such as “will,” “should,” “may,” “anticipate,” “believe,” “expect” and “intend” indicate a forward-looking statement, although not all forward-looking statements include these words.
The purpose of the report is to illustrate how accepted financial and estate planning principles may improve your current situation. The term “plan” or “planning,” when used within this report, does not imply that a recommendation has been made to implement one or more financial plans or make a particular investment. You should use this Report to help you focus on the factors that are most important to you. This Report does not provide legal, tax, or accounting advice. Before making decisions with legal, tax, or accounting ramifications, you should consult appropriate professionals for advice that is specific to your situation.
Advisory Persons of Thrivent provide advisory services under a “doing business as” name or may have their own legal business entities. However, advisory services are engaged exclusively through Thrivent Advisor Network, LLC, a registered investment adviser. Cedar Cove Wealth Partners and Thrivent Advisor Network, LLC are not affiliated companies. Information in this message is for the intended recipient[s] only. Please visit our website www.cedarcovewealth.com for important disclosures.
Securities offered through Purshe Kaplan Sterling Investments (“PKS”), Member FINRA/SIPC. PKS is headquartered at 80 State Street, Albany, NY 12207. PKS and Cedar Cove Wealth Partners are not affiliated companies.
Index Benchmarks presented within this report may not reflect factors relevant for your portfolio or your unique risks, goals or investment objectives. Past performance of an index is not an indication or guarantee of future results. It is not possible to invest directly in an index.
- The S&P 500 is a capitalization-weighted index designed to measure performance of the broad domestic economy through changes in the aggregate market value of 500 stocks representing all major industries.
- Russell 2000 consists of the 2,000 smallest U.S. companies in the Russell 3000 index.
- MSCI EAFE is an equity index which captures large and mid-cap representation across Developed Markets countries around the world, excluding the U.S. and Canada. The index covers approximately 85% of the free float-adjusted market capitalization in each country.
- MSCI Emerging Markets captures large and mid-cap representation across Emerging Markets countries. The index covers approximately 85% of the free-float adjusted market capitalization in each country.
- Bloomberg U.S. Aggregate Index covers the U.S. investment grade fixed rate bond market, with index components for government and corporate securities, mortgage pass-through securities, and asset-backed securities.
- Bloomberg U.S. Corporate High Yield Index covers the universe of fixed rate, non-investment grade debt. Eurobonds and debt issues from countries designated as emerging markets (sovereign rating of Baa1/BBB+/BBB+ and below using the middle of Moody’s, S&P, and Fitch) are excluded, but Canadian and global bonds (SEC registered) of issuers in non-EMG countries are included.
- FTSE NAREIT Equity REITs Index contains all Equity REITs not designed as Timber REITs or Infrastructure REITs.
- Bloomberg Commodity Index is calculated on an excess return basis and reflects commodity futures price movements. The index rebalances annually weighted 2/3 by trading volume and 1/3 by world production and weight-caps are applied at the commodity, sector and group level for diversification.
- The CBOE (Chicago Board Options Exchange) Volatility Index®, or VIX, is a real-time market index representing the market’s expectations for volatility over the coming 30 days.
- The Consumer Price Index (CPI) is a measure of the average change over time in the prices paid by urban consumers for a market basket of consumer goods and services.
Material Risks
- Fixed Income securities are subject to interest rate risks, the risk of default and liquidity risk. U.S. investors exposed to non-U.S. fixed income may also be subject to currency risk and fluctuations.
- Cash may be subject to the loss of principal and over longer periods of time may lose purchasing power due to inflation.
- Domestic Equity can be volatile. The rise or fall in prices take place for a number of reasons including, but not limited to changes to underlying company conditions, sector or industry factors, or other macro events. These may happen quickly and unpredictably.
- International Equity can be volatile. The rise or fall in prices take place for a number of reasons including, but not limited to changes to underlying company conditions, sector or industry impacts, or other macro events. These may happen quickly and unpredictably. International equity allocations may also be impact by currency and/or country specific risks which may result in lower liquidity in some markets.
- Real Assets can be volatile and may include asset segments that may have greater volatility than investment in traditional equity securities. Such volatility could be influenced by a myriad of factors including, but not limited to overall market volatility, changes in interest rates, political and regulatory developments, or other exogenous events like weather or natural disaster.
- Private Real Estate involves higher risk and is suitable only for sophisticated investors. Real estate assets can be volatile and may include unique risks to the asset class like leverage and/or industry, sector or geographical concentration. Declines in real estate value may take place for a number of reasons including, but are not limited to economic conditions, change in condition of the underlying property or defaults by the borrow.
Definitions
- The Bureau of Labor Statistics (BLS) is an agency of the United States Department of Labor. It is the principal fact-finding agency in the broad field of labor economics and statistics and serves as part of the U.S. Federal Statistical System. BLS collects, calculates, analyzes, and publishes data essential to the public, employers, researchers, and government organizations.
- Basis points are typically expressed with the abbreviations bp, bps, or bips. A basis point is a common unit of measure for interest rates and other percentages in finance. One basis point is equal to 1/100th of 1%, or 0.01%. In decimal form, one basis point appears as 0.0001 (0.01/100).
- The CME FedWatch Tool is a tool created by the CME Group (Chicago Mercantile Exchange Group) to act as a barometer for the market’s expectation of potential changes to the fed funds target rate while assessing potential Fed movements around Federal Open Market Committee (FOMC) meetings.
- The Magnificent 7 (or Mag 7) stocks are a group of mega-cap stocks that drive the market’s performance due to their heavy weighting in major stock indexes such as the Standard & Poor’s 500 and the Nasdaq 100. The group’s seven stocks earned their name in 2023 due to their strong performance and ability to power indexes higher seemingly without help from smaller stocks. The Magnificent 7 includes the following: Apple (AAPL), Microsoft (MSFT), Alphabet (GOOG and GOOGL), Amazon (AMZN), NVIDIA (NVDA), Tesla (TSLA), and Meta Platforms (META).
- A real estate investment trust (REIT) is a company that owns, operates, or finances income-generating real estate.
