
Rate Cuts and Deficits and Elections, Oh My!
Q3, 2024 Market Commentary
Summary
- U.S. large-cap stocks gained 5.9% during the third quarter while U.S. small caps rose 9.3%. The Bloomberg U.S. Aggregate Bond Index had its best September since 2003.
- The Federal Reserve cut interest rates by 50 basis points, and it is expected to cut another 50 basis points before year end.
- The U.S. Treasury’s fiscal year ended in September with a $1.9 trillion deficit, the largest ever in a non-recession year.
- Investors face ambiguity around interest rates, the growing deficit, and upcoming elections, requiring nuanced vigilance in portfolio construction.
Overview
Markets performed well over the third quarter, and every major asset class is now positive for the year to date. In fact, this was the best first nine months of the year for U.S. large-cap stocks since 1997. U.S. large-cap stocks, as represented by the S&P 500 Index, gained 5.9% over the third quarter and are up 22.1% year to date. The Russell 2000 Index of U.S. small cap stocks ended the quarter up 9.3% and are up 11.2% year to date. Notably, September was the best month for the Bloomberg U.S. Aggregate Bond Index since 2003. U.S. intermediate-term bonds gained 1.3% over the month, 5.2% for the quarter, and 4.4% year to date.
Final second-quarter gross domestic product (GDP) estimates indicated that annualized quarter-over-quarter growth rose from 1.6% in the first quarter to 3.0% in the second quarter.1 Compared to the first quarter, the acceleration in GDP was primarily driven by increased government spending (rising from 1.8% of GDP to 3.1% in the second quarter) and consumer spending (from 1.9% to 2.8%).1
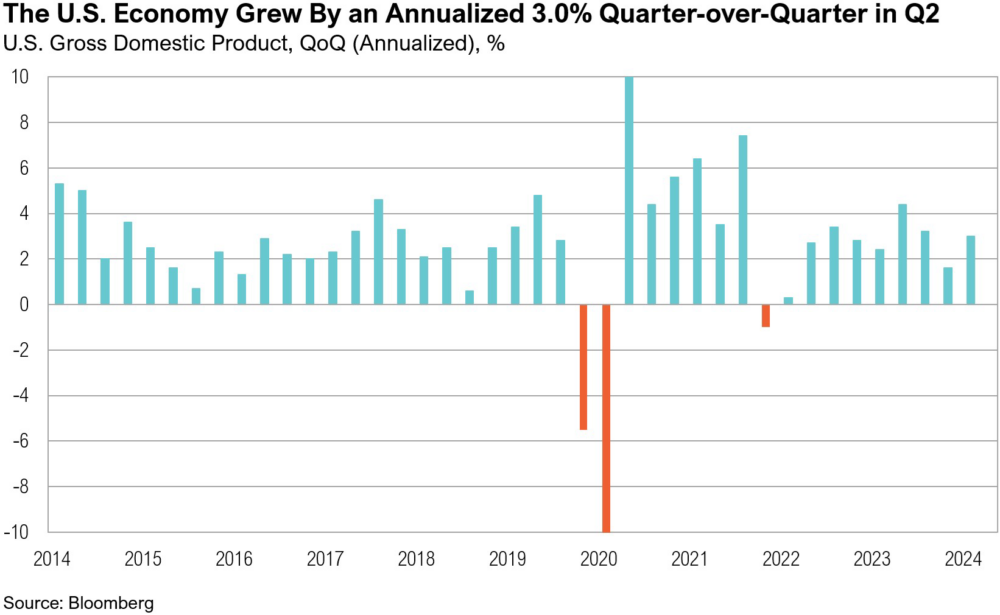
During the quarter, the Bureau of Economic Analysis released its annual data revisions, notably upping second-quarter 2022 GDP from a previously reported decline of 0.6% to growth of 0.4%, quarter over quarter.2 This revision means that the economy did not in fact contract for two consecutive quarters—which would have met the informal definition of a technical recession.
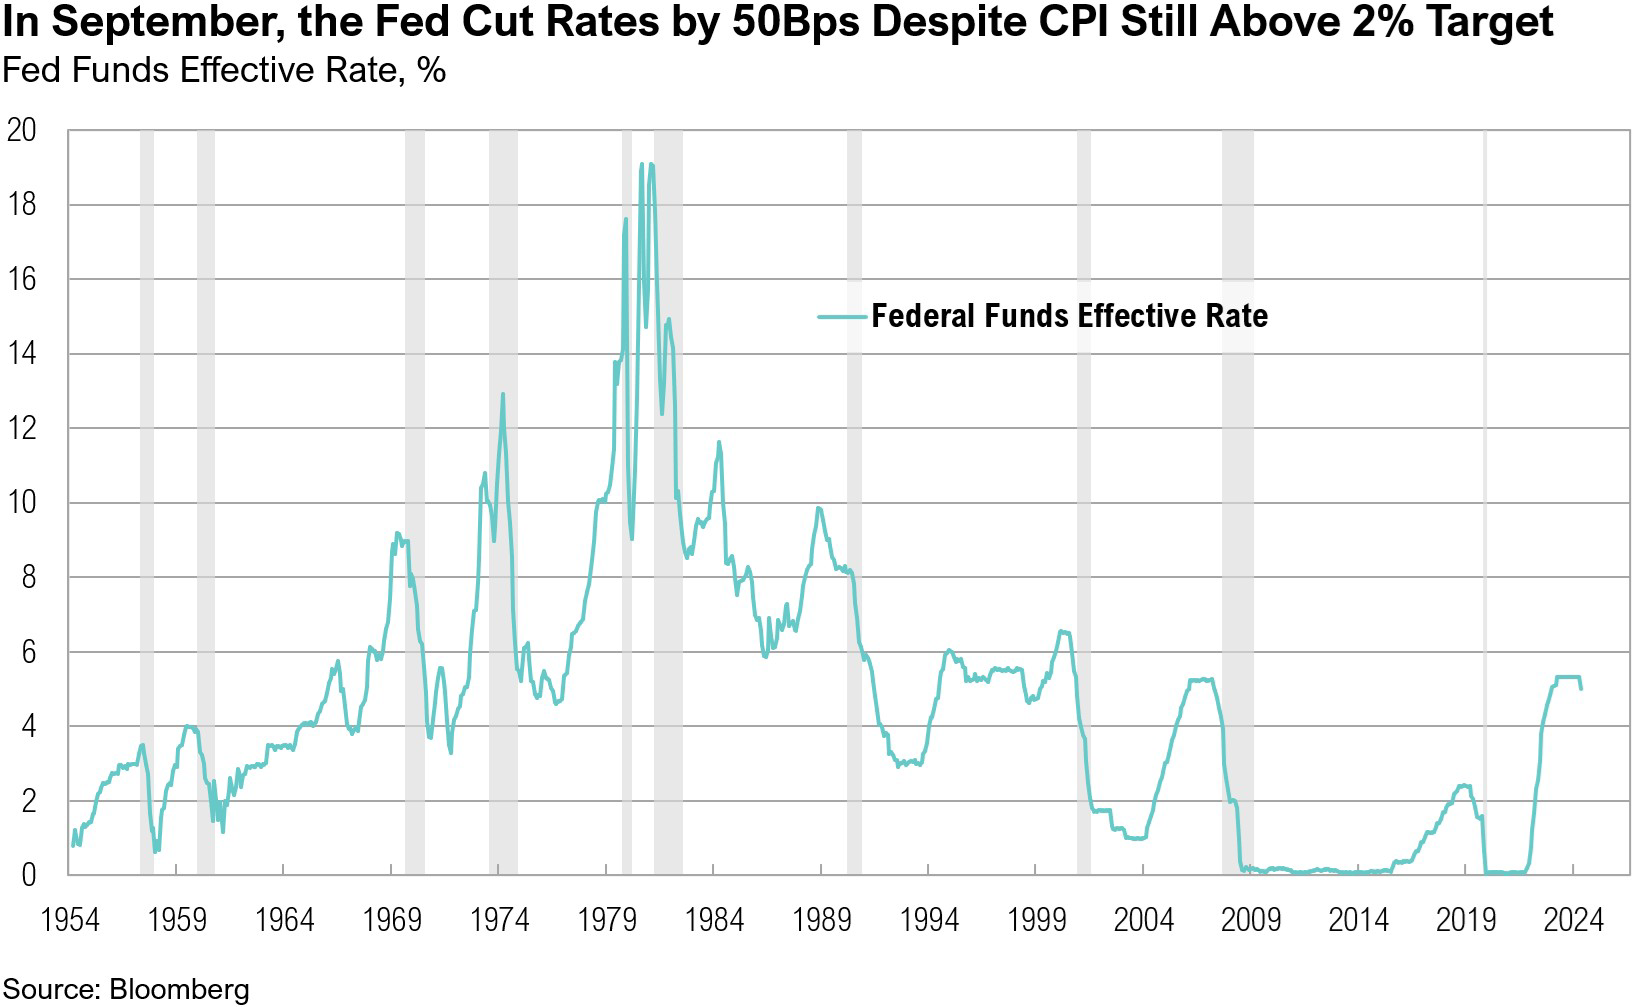
Although inflation has fallen significantly since it reached its four-decade high of 9.1% in June 2022, it has remained above the Federal Reserve’s official 2% target for over three-and-a-half years. The August inflation report, released in September, showed headline inflation at a 41-month low of 2.6% on a year-over-year basis.3 The labor market remains resilient, and the U.S. economy continues to add new jobs. In September, the economy added 254,000 new jobs, far surpassing the expected 150,000.4 Further, the unemployment rate ticked marginally lower over the quarter, from 4.3% in July to 4.1% in September.4
Following one of the most aggressive interest rate hiking cycles in history, it’s easy to forget that interest rates were near 0% as recently as March 2022.5 Between March 2022 and July 2023, the Fed raised rates by 5.0%, maintaining a target range of 5.25% to 5.50% for fourteen months until September. At the September Federal Open Market Committee (FOMC) meeting, the Federal Reserve cut interest rates by 50 basis points. This cut occurred even with both core and headline inflation above target, a robust labor market, and no signs of stress in financial markets.
Rate Cuts and Deficits and Elections, Oh My!
August of this year marked the 85th anniversary of The Wizard of Oz. Throughout the third quarter, investors found themselves on their own yellow brick road, navigating a forest of election unpredictability, a unique rate cut, and an ever-growing U.S. fiscal deficit—hoping the journey will ultimately lead to the economic equivalent of the Emerald City: a soft landing.

In September, the Fed cut interest rates and signaled the start of a new rate-cutting cycle. Although largely anticipated (markets were pricing in a 65% probability of a 50-basis point cut two days before the announcement), such a significant cut—especially the first in a cycle—is unusual, typically occurring only in times of crisis.6,7 Similar 50-basis point cuts occurred before the start of the recession in January 2001, before the Global Financial Crisis in September 2007, and during the pandemic in March 2020. A 50-basis point cut in the current benign economic environment is unprecedented.
At the post-FOMC meeting press conference on September 18, even Chair Jerome Powell noted the strength in the labor market:
“This recalibration of our policy stance will help maintain the strength of the economy and the labor market and will continue to enable further progress on inflation as we begin the process of moving toward a more neutral stance.”8
With both core and headline inflation above the official 2% target, financial conditions at their loosest since May 2022, and the labor market not showing signs of significant cooling, it’s debatable whether the Fed’s recent 50 basis point rate cut was justified. Indeed, addressing this very concern, Powell expanded on the FOMC’s decision in the press conference:
“There is thinking that the time to support the labor market is when it’s strong and not when you begin to see the layoffs…We don’t think we need to see further loosening in labor market conditions to get inflation down to 2 percent.”8
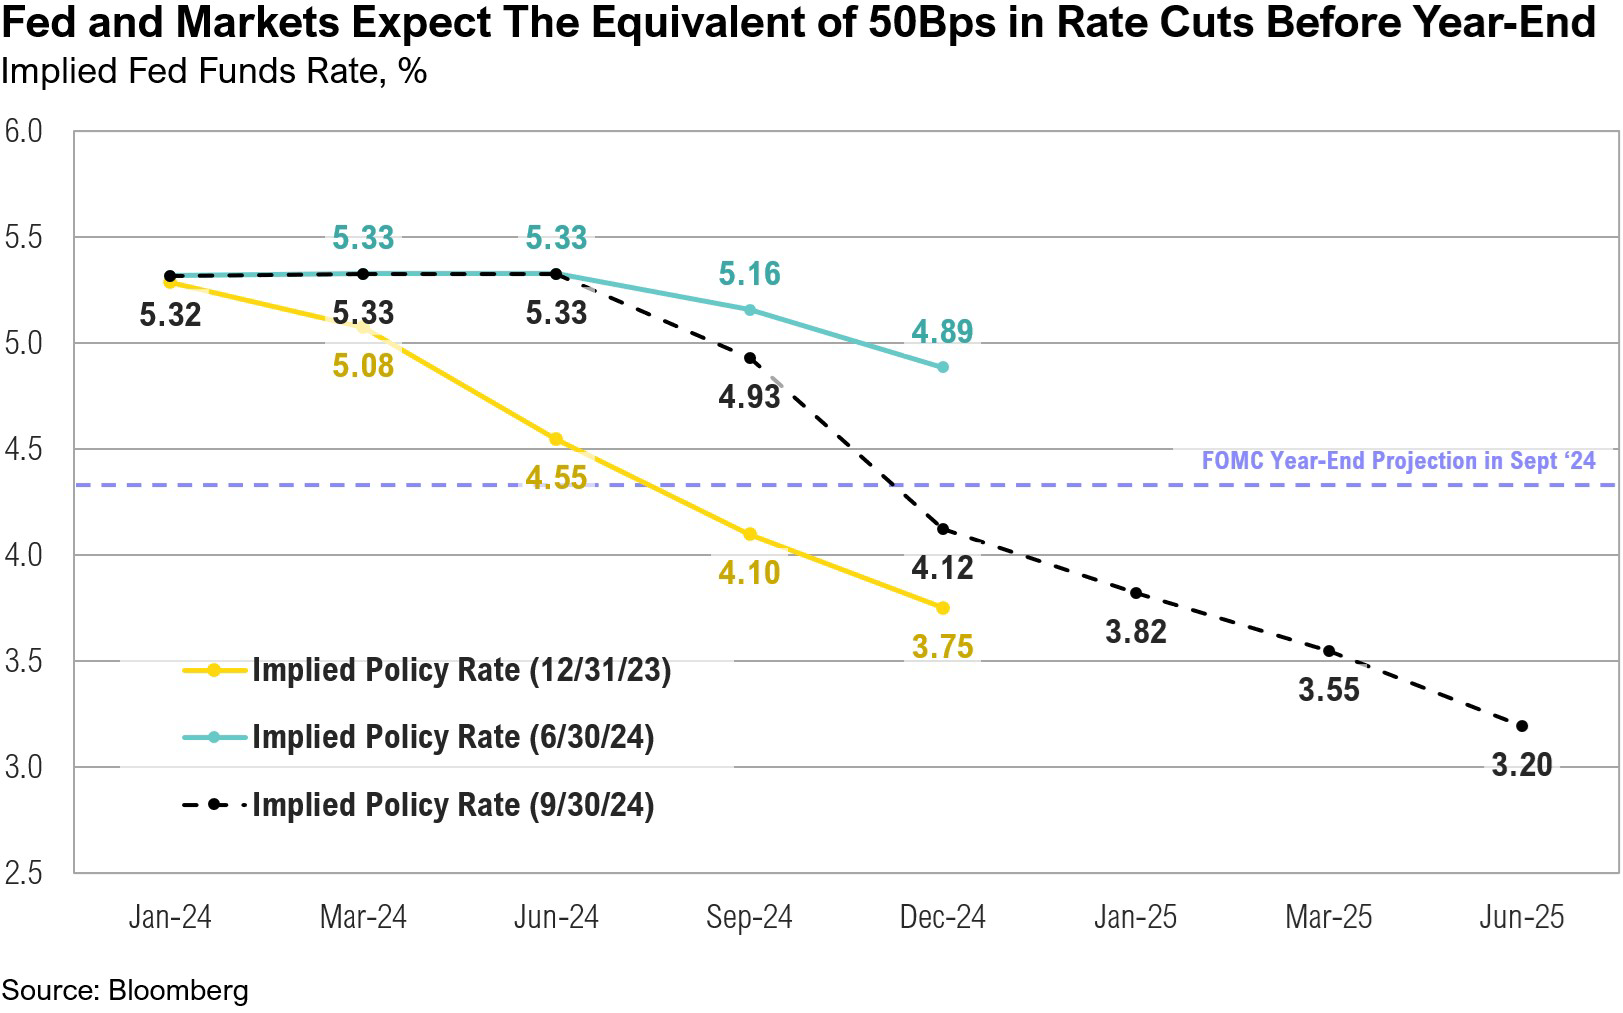
Initial jobless claims, for example, are nearly 60% lower at this rate cut than at the time of the January 2001 initial rate cut and 40% lower than at the time of the September 2007 initial cut.9 The Fed’s recent 50-basis point cut may be overcompensating for past mistakes by acting more aggressively now, perhaps trying to avoid the error of moving too slowly ahead of prior recessions. However, the Fed’s more lenient approach to monetary policy could re-accelerate growth and cause inflation to reverse course from its current cooling trend. Further, the move could encourage risk-taking behavior and push up asset prices. (The forward price-to-earnings ratio for the S&P 500 is currently elevated at 21.5, but still below the Tech Bubble peak of 25.1, indicating that valuations could become even more stretched.) Whether the Fed will ultimately be willing—or able—to defeat the “Wicked Witch” of inflation remains to be seen. Both the Fed and markets are expecting the equivalent of another 50-basis-point reduction by year end, implying a 25-basis-point cut at each of the remaining FOMC meetings in 2024, bringing interest rates down to a range of 4.25% to 4.50%.6
Equity markets cheered the Fed’s announcement, and the S&P 500 rose 2.6% between September 18 and September 30. Market breadth also improved as rate-sensitive areas of the market rallied throughout the third quarter, both in anticipation of and following the Fed’s first rate cut. Notably, 45% of S&P 500 constituents outperformed the broader index over the past three months, a significant improvement from just 26% six months ago.10 The technology and communication services sectors both climbed over 4% between September 18 and September 30. The utilities sector also saw strong gains, rising 3.6% between September 18 and the end of the month, finishing the quarter up 19.4%. After a robust third quarter, utilities have now surpassed the technology sector to become the S&P 500’s top-performing sector in 2024, up 30.6%. The real estate sector closed the quarter with a gain of over 17%, and U.S. small-cap stocks advanced 9.3%. Small-cap stocks are particularly sensitive to interest rates due to relatively high debt levels and the high ratio (approximately 42%) of unprofitable companies in the Russell 2000 Index.11
In contrast to risky assets, the Treasury market appeared to play the role of Scarecrow as it digested the rate cut. Notably, the 10-year Treasury yield, which reached a one-year low of 3.6% on September 16—just two days before the Fed’s rate cut—ended the month 20 basis points higher, at 3.8%, while reaching nearly 4.0% just after the jobs report was announced in early October. The rise in yields could be signaling the bond market’s recognition that the Fed may tolerate higher inflation or could reflect underlying concerns about the precarious U.S. fiscal situation, especially the weight of rising debt and the structural deficit burden, which threaten to drive up long-term borrowing costs, regardless of the Fed’s actions.12
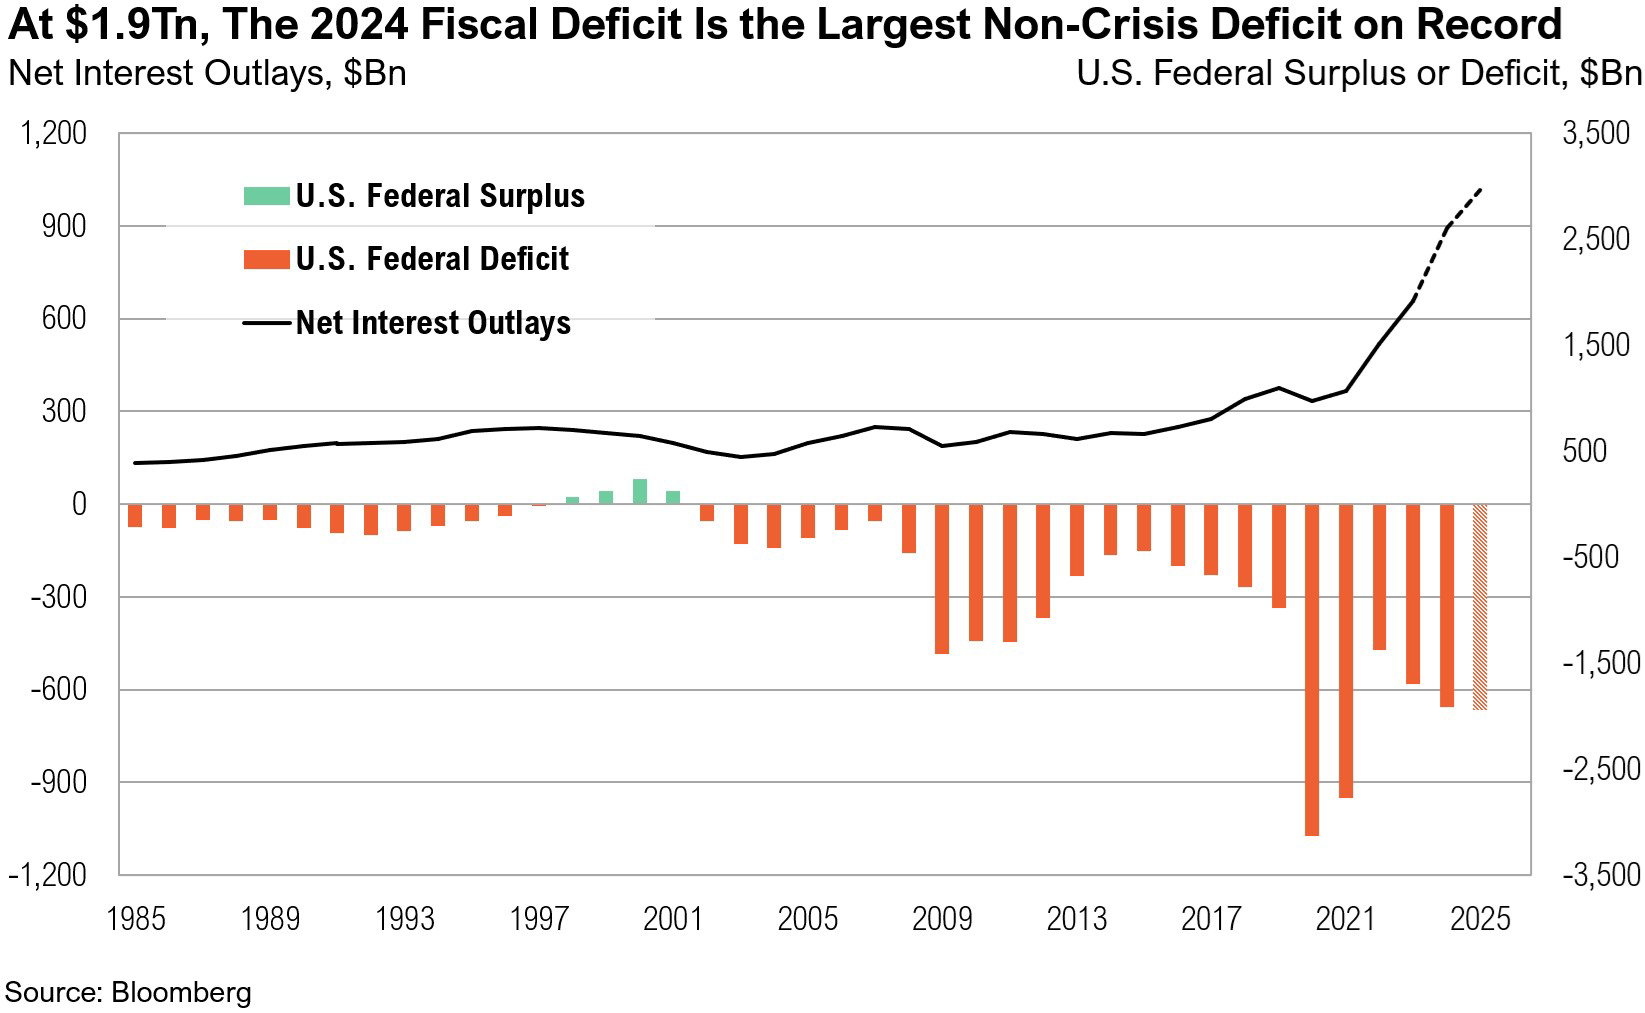
Despite the pandemic having ended several years ago, the U.S. economy continues to be driven by crisis-era government spending, which is producing multi-trillion-dollar deficits with no end in sight. The close of the third quarter marked the end of the U.S. Treasury’s fiscal year, and the most recent Treasury monthly budget statement shows that the budget deficit has ballooned to $1.9 trillion, making the 2024 deficit the largest ever in a non-crisis or non-recession year. Net interest outlays have surged to $843 billion, surpassing both defense spending ($798 billion) and health expenditures ($824 billion).13 The U.S. government is currently paying an average of $3 billion in interest expenses each day, including weekends.14 A further 50-basis-point decline in interest rates, as expected by year end, is estimated to reduce these daily interest payments to $2.5 billion.14
As Election Day approaches, neither presidential candidate has provided a detailed plan to address the deficit. Both candidates have avoided discussing the necessary policies to tackle the issue, and the deficit was only mentioned twice during the September 10 presidential debate.15 Current estimates suggest that both former President Trump and Vice President Harris’s spending policies would add at least $6 trillion to the deficit over the next decade.16,17 An additional risk is the potential for inflation to rise again if the growing deficit pressures the Fed to print more money to help the government manage its debt.17 Despite these unsustainable spending trends, longer-term Treasury yields have remained relatively stable. Regardless of individual opinions of the sustainability of deficits and how and when they should be addressed, the bond market will likely be the final arbiter of the sustainability of the U.S. fiscal strategy—or lack thereof. Investors should take notice if and when bond markets reach their limit and begin to push back against excessive government spending.
With just two months remaining until the 2024 presidential election, the race remains tight, and it appears increasingly likely that the path to the White House will hinge on just seven key swing states: Nevada, Arizona, Michigan, North Carolina, Wisconsin, Georgia, and perhaps most critically, Pennsylvania. Current trends and polls suggest the path to 270 electoral votes will be difficult for either candidate without Pennsylvania, which holds 19 electoral votes.18,19,20 In such a close race, voter turnout will be vital, particularly among young voters, who have historically participated at lower rates.21 Since 1988, voter turnout amongst those aged 18 to 29 years has averaged at 42%, compared to 56% for those aged 30 to 44, 66% for those aged 45 to 59 years, and a 69% voter turnout for those 60 years and older.
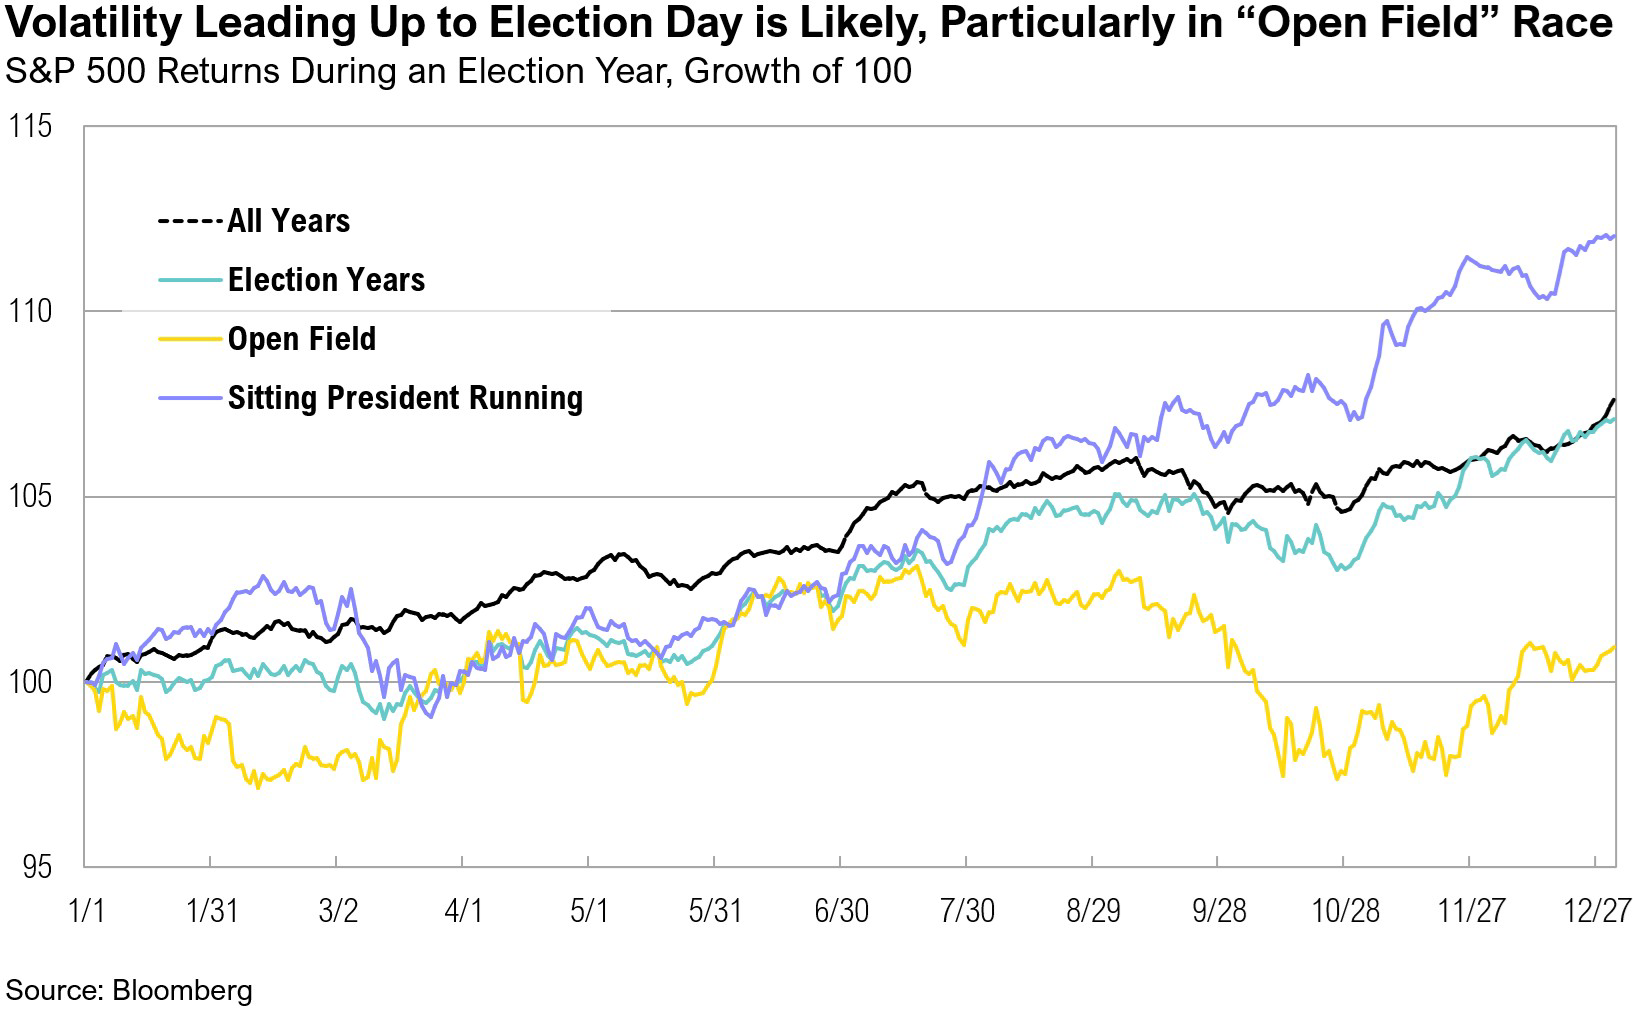
While it is too close to predict the election outcome, it would not be unusual for volatility to rise as Election Day approaches, especially given the incumbent president is not seeking re-election. However, markets typically rally once the uncertainty surrounding the election is resolved.
Markets
International equities slightly outperformed their U.S. counterparts in the third quarter. International developed market stocks, as represented by the MSCI EAFE Index, outpaced U.S. large-cap stocks, which ended the quarter up 5.9%, by 1.4%. Similarly, international developed market small- and micro-cap stocks rose 10.7% for the quarter, compared to a 9.3% gain for U.S. small-cap stocks. Emerging markets also performed well, finishing the third quarter up 8.9% to be the second-best performing equity asset class year to date, behind U.S. large cap stocks. Emerging market gains were driven by the MSCI China Index, which surged 23.5% on news of economic stimulus, and the MSCI South Africa Index, which gained 16.1%, continuing the positive momentum from the second quarter following a favorable election outcome. Meanwhile, U.S. intermediate-term bonds gained 5.2% in the third quarter and are up 4.4% year-to-date.
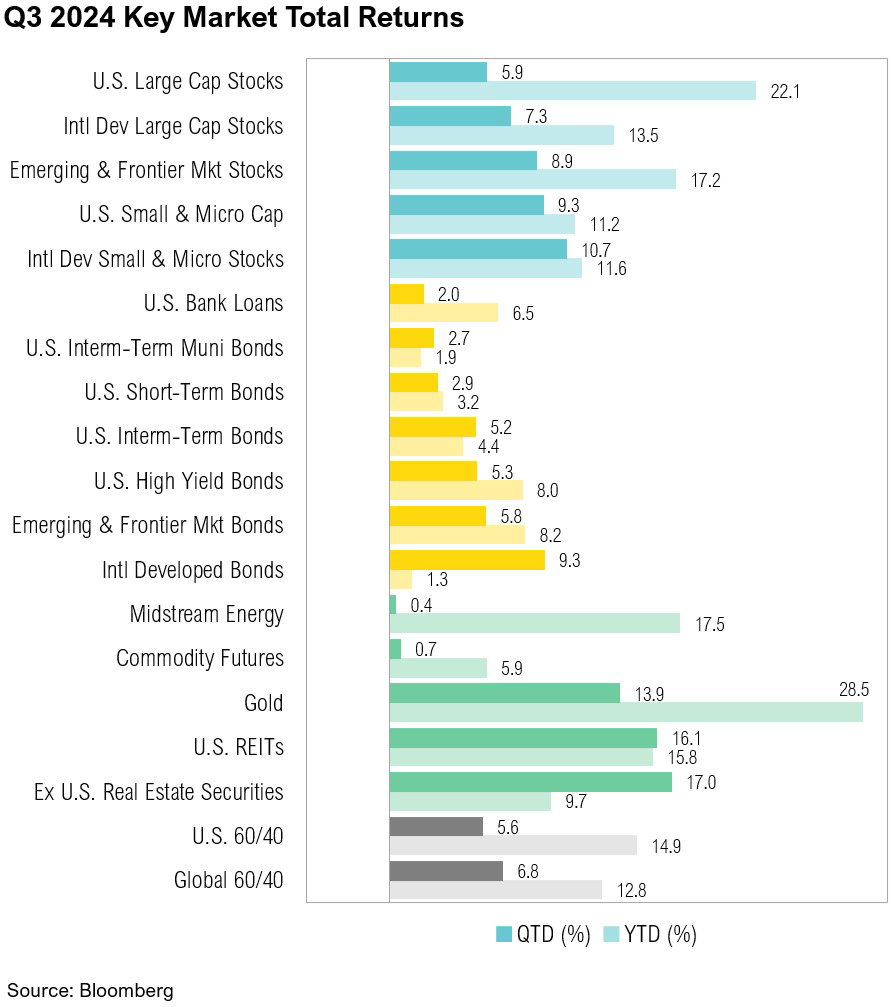
Gold ended the third quarter up 13.9%, reaching a new record high of $2,675 per ounce in September. Since the start of the year, gold has set 35 new record highs and is up 28.5%. West Texas Intermediate (WTI) crude oil hit a one-year low of $65.8 per barrel on September 10 but ended the quarter at $68.2. Then in early October, it spiked above $75 per barrel on news of escalating conflict in the Middle East and the strong U.S. jobs report.
It was a busy quarter in Japan. In response to currency weakness in June, the Bank of Japan raised interest rates from 0.1% to 0.25% in July, pushing Japanese rates to their highest level since 2008. This decision, along with the rapid strengthening of the yen, placed carry traders in a precarious position as they faced increased loan repayment costs in U.S. dollars due to the yen’s appreciation. The unexpected shift forced some traders to liquidate assets to repay yen-denominated loans, reflecting a widespread miscalculation that Japan’s interest rates would remain at zero indefinitely. This dynamic coincided with a weaker-than-expected U.S. July jobs report and a slowdown in U.S. manufacturing activity, triggering a market rout in early August, which was followed by a swift recovery in stock markets in both the U.S. and Japan. The Bank of Japan has since signaled its commitment to further rate hikes, in contrast to other major global central banks, most of which have begun cutting rates.22,23 Japanese stocks ended the quarter up 5.8% and are up 12.4% for the year.
On September 24, the People’s Bank of China announced a series of economic stimulus measures, including interest rate cuts, increased government spending, and eased property market restrictions to boost sluggish growth amid a weak real estate sector and declining consumer confidence.24,25 These measures are estimated to raise China’s GDP by 40 basis points.26 Chinese stocks surged following the policy announcements, and the CSI 300 Index experienced its best 10-day rolling returns on record, climbing over 20% through the end of the quarter.
Looking Forward
“We’re not in Kansas anymore” seems fitting as we look at the unusual policy mix of crisis-level deficits and a Federal Reserve that is taking a historically lenient approach to inflation, even as the economy seems to be humming along. Over the last four years, core inflation has run at an average annual rate of 4.8%, and the U.S. is spending more than $1.43 for every $1.00 it collects in taxes.27,13 When The Wizard of Oz was released in 1939, it served as a story of hope and escape amidst economic and geopolitical turmoil. The U.S., still emerging from the Great Depression, was running a 3% fiscal deficit—considered aggressive but necessary with unemployment at 17.2%. Today, while unemployment is a much lower 4.1%, our deficit is more than double that of 1939.28,29
Like Dorothy’s uncertain journey, investors must face ambiguity around interest rates, the deficit, and the upcoming election. Policymakers seem content with decisions that prioritize the here and now at the expense of long-term fiscal stability, thereby limiting their ability to respond to future crises and threatening the role of the U.S. dollar in global trade. Given this landscape, we maintain that diversification should include healthy exposures to risk, minimal longer-term bonds, and hedges against policies that will result in the continued erosion of purchasing power.
Disclosures
Advisory Persons of Thrivent Advisor Network provide advisory services under a “doing business as” name or may have their own legal business entities. However, advisory services are engaged exclusively through Thrivent Advisor Network, LLC, a registered investment adviser. Cedar Cove Wealth Partners and Thrivent Advisor Network, LLC are not affiliated companies.
Securities offered through Thrivent Investment Management Inc. (“TIMI”), member FINRA and SIPC, and a subsidiary of Thrivent, the marketing name for Thrivent Financial for Lutherans. Thrivent.com/disclosures. TIMI and Cedar Cove Wealth Partners are not affiliated companies.
The material presented includes information and opinions provided by a party not related to Thrivent Advisor Network. It has been obtained from sources deemed reliable; but no independent verification has been made, nor is its accuracy or completeness guaranteed. The opinions expressed may not necessarily represent those of Thrivent Advisor Network or its affiliates. They are provided solely for information purposes and are not to be construed as solicitations or offers to buy or sell any products, securities, or services. They also do not include all fees or expenses that may be incurred by investing in specific products. Past performance is no guarantee of future results. Investments will fluctuate and when redeemed may be worth more or less than when originally invested. You cannot invest directly in an index. The opinions expressed are subject to change as subsequent conditions vary. Thrivent Advisor Network and its affiliates accept no liability for loss or damage of any kind arising from the use of this information.
Index Benchmarks presented within this report may not reflect factors relevant for your portfolio or your unique risks, goals or investment objectives. Past performance of an index is not an indication or guarantee of future results. It is not possible to invest directly in an index.
The Bloomberg U.S. Aggregate Bond® Index, or the Agg, is a broad base, market capitalization-weighted bond market index representing intermediate term investment grade bonds traded in the United States. Investors frequently use the index as a stand-in for measuring the performance of the U.S. bond market.
The Consumer Price Index (CPI) is a measure of the average change over time in the prices paid by urban consumers for a market basket of consumer goods and services.
The MSCI (Morgan Stanley Capital International) China® Index captures large and mid-cap representation across China A shares, H shares, B shares, Red chips, P chips and foreign listings (e.g. ADRs). With 717 constituents, the index covers about 85% of this China equity universe.
The MSCI EAFE® (Morgan Stanley Capital International Europe, Australasia, and the Far East) Index is a broad market index of stocks located within countries in Europe, Australasia, and the Middle East.
The MSCI (Morgan Stanley Capital International) South Africa Index is designed to measure the performance of the large and mid-cap segments of the South African market. With 37 constituents, the index covers approximately 85% of the free float-adjusted market capitalization in South Africa.
The Russell 2000® Index measures the performance of the 2,000 smaller companies that are included in the Russell 3000® Index, which itself is made up of nearly all U.S. stocks. The Russell 2000® is widely regarded as a bellwether of the U.S. economy because of its focus on smaller companies that focus on the U.S. market.
The S&P 500® Index, or the Standard & Poor’s 500® Index, is a market-capitalization-weighted index of the 500 largest U.S. publicly traded companies.
West Texas Intermediate Index (WTI) is the main oil benchmark for North America as it is sourced from the United States, primarily from the Permian Basin. The oil comes mainly from Texas.
Definitions
The Bureau of Economic Analysis (BEA) is an agency of the Department of Commerce that produces economic accounts statistics that enable government and business decision-makers, researchers, and the American public to follow and understand the performance of the nation’s economy. To do this, BEA collects source data, conducts research and analysis, develops and implements estimation methodologies, and disseminates statistics to the public.
The Bureau of the Fiscal Service (BFS) is a United States Department of the Treasury agency that manages the federal government’s accounting, collections, payments, and public debt.
The Bureau of Labor Statistics (BLS) is an agency of the United States Department of Labor. It is the principal fact-finding agency in the broad field of labor economics and statistics and serves as part of the U.S. Federal Statistical System. BLS collects, calculates, analyzes, and publishes data essential to the public, employers, researchers, and government organizations.
Basis points are typically expressed with the abbreviations bp, bps, or bips. A basis point is a common unit of measure for interest rates and other percentages in finance. One basis point is equal to 1/100th of 1%, or 0.01%. In decimal form, one basis point appears as 0.0001 (0.01/100).
Capitalization (Cap) is used to describe the size of the company, by market capitalization as follows:
- mega-cap: market value of $200 billion or more.
- large cap: market value between $10 billion and $200 billion.
- mid-cap: market value between $2 billion and $10 billion.
- small cap: market value between $250 million and $2 billion.
- micro-cap: market value of less than $250 million.
The CME FedWatch Tool is a tool created by the CME Group (Chicago Mercantile Exchange Group) to act as a barometer for the market’s expectation of potential changes to the fed funds target rate while assessing potential Fed movements around Federal Open Market Committee (FOMC) meetings.
The Federal Open Market Committee (FOMC) is the branch of the Federal Reserve System that determines the direction of monetary policy. The FOMC has 12 voting members, including all seven members of the Board of Governors and a rotating group of five Reserve Bank presidents. The Chair of the Board of Governors also serves as Chair of the FOMC.
FRED (Federal Reserve Economic Data) is an online database consisting of hundreds of thousands of economic data time series from scores of national, international, public, and private sources.
Gross domestic product (GDP) is the total monetary or market value of all the finished goods and services produced within a country’s borders in a specific time period. As a broad measure of overall domestic production, it functions as a comprehensive scorecard of a given country’s economic health.
Performance Disclosures
All market pricing and performance data from Bloomberg, unless otherwise cited. Asset class and sector performance are gross of fees unless otherwise indicated.
Citations
- BEA: https://www.bea.gov/sites/default/files/2024-09/gdp2q24-3rd.pdf
- BEA: https://www.bea.gov/sites/default/files/2024-09/NEA-AU24-Briefing.pdf
- FRED: https://fred.stlouisfed.org/series/CPIAUCSL
- BLS: https://www.bls.gov/news.release/empsit.nr0.htm
- FRED: https://fred.stlouisfed.org/series/FEDFUNDS
- CME FedWatch: https://www.cmegroup.com/markets/interest-rates/cme-fedwatch-tool.html
- Forbes: https://www.forbes.com/advisor/investing/fed-funds-rate-history/
- Federal Reserve: https://www.federalreserve.gov/mediacenter/files/FOMCpresconf20240918.pdf
- FRED: https://fred.stlouisfed.org/series/ICSA
- Liz Ann Sonders via X: https://x.com/LizAnnSonders/status/1841083134366158982/photo/2
- Wall Street Journal: https://www.wsj.com/finance/stocks/if-a-soft-landing-is-in-the-cards-why-arent-small-cap-stocks-rallying-475b8b66
- CNBC: https://www.cnbc.com/2024/09/26/the-fed-slashed-interest-rates-last-week-but-treasury-yields-are-rising-whats-going-on-.html
- Bureau of the Fiscal Service: https://www.fiscal.treasury.gov/files/reports-statements/mts/mts0824.pdf
- Apollo Academy: https://www.apolloacademy.com/3-billion-per-day-in-interest-expenses/
- The American Presidency Project: https://www.presidency.ucsb.edu/documents/presidential-debate-philadelphia-pennsylvania
- Wall Street Journal: https://www.wsj.com/politics/policy/federal-debt-deficit-trump-harris-5a0d30d2?mod=hp_lead_pos7
- CNN: https://edition.cnn.com/2024/09/27/economy/deficit-danger-harris-trump/index.html
- 270ToWin: https://www.270towin.com/2024-presidential-election-polls/
- Real Clear Politics: https://www.realclearpolitics.com/epolls/latest_polls/national_president/index.html
- FiveThirtyEight: https://projects.fivethirtyeight.com/2024-election-forecast/?cid=rrpromo#electoral-college-probability
- Statista: https://www.statista.com/statistics/1096299/voter-turnout-presidential-elections-by-age-historical/
- CNBC: https://www.cnbc.com/2024/08/30/the-bank-of-japan-is-certain-to-raise-rates-further-the-question-is-when.html
- Reuters: https://www.reuters.com/markets/asia/some-boj-members-saw-scope-hike-rates-further-july-meeting-minutes-show-2024-09-26/
- Bloomberg: https://www.bloomberg.com/news/articles/2024-09-24/china-frees-banks-to-lend-more-cuts-key-interest-rate
- Reuters: https://www.reuters.com/world/china/china-unveils-broad-stimulus-measures-revive-economy-2024-09-24/
- TradingView: https://www.tradingview.com/news/forexlive:a79e2d24e094b:0-china-is-on-holidays-goldman-sachs-take-the-opportunity-to-shrug-off-all-the-stimulus/
- FRED: https://fred.stlouisfed.org/series/CPILFESL
- FRED: https://fred.stlouisfed.org/series/FYFSGDA188S
- Statista: https://www.statista.com/statistics/1315397/united-states-unemployment-number-rate-historical/
