Market Commentary
THE AMERICAN DREAM
October 2024
Summary
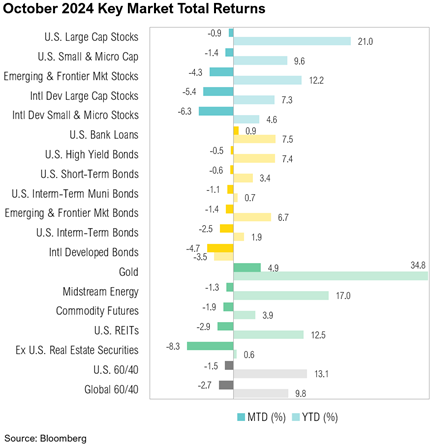
- U.S. large-cap stocks declined 0.9% in October while small-cap stocks declined by 1.4%. Bonds also fell; the Bloomberg U.S. Aggregate Bond Index decreased 2.5%.
- Headline inflation eased to 2.4% year-over-year, and even with a solid labor market, markets still expect an additional 0.5% in rate cuts by year end.
- Treasury yields and mortgage rates have risen since the September Fed rate cut, leading to elevated mortgage rates and increased home prices, as well as a decline in home sales.
- Polls show a very close election, creating uncertainty around the future monetary and fiscal policies that will significantly shape market returns. Regardless of the outcome, however, the fiscal deficit is expected to grow.
Overview
Markets posted mostly negative returns in October. U.S. large-cap stocks, as represented by the S&P 500, declined 0.9% while the Russell 2000 small-cap index fell by 1.4%. The Bloomberg U.S. Aggregate Bond Index dropped 2.5%. The September inflation report, released on October 10, showed headline inflation easing to 2.4% year over year, reaching the lowest level since February 2021. Core inflation, however, edged up slightly from 3.2% to 3.3%.1 Both headline and core inflation were 0.1% above forecast for September, largely due to rising food prices, which offset declines in gasoline and energy costs. Notably, food-at-home prices increased by 1.3% year over year, marking the highest increase since January 2023.
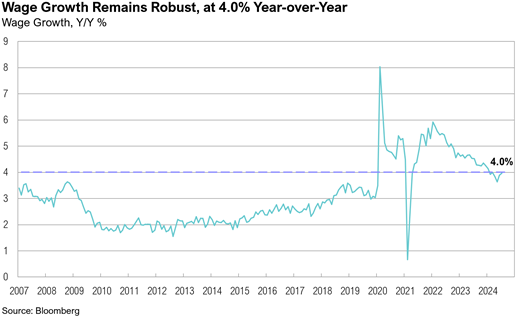
In October, despite job growth coming in below expectations (likely due to storms and strikes), the unemployment rate remained steady at 4.1%.2 Wage growth also remained robust, increasing by 4.0% year-over-year.2 Outside of COVID-19, this continues to be the highest wage growth over the past 20 years. Initial jobless claims, which averaged 236,500 in October, are at pre-COVID-19 levels.3 Preliminary estimates indicate the U.S. economy grew at an annualized rate of 2.8% quarter over quarter in the third quarter.4 Economic growth was primarily driven by increases in consumer and government spending. Consumer spending, which comprises nearly two-thirds of U.S. economic activity, rose by 3.7%—its strongest growth since the first quarter of 2023.4 Federal government spending, which drove the 2024 fiscal budget deficit to $1.8 trillion, increased by 5.0%. Imports, which detract from GDP, grew by 11% and offset the 8.9% rise in exports. Additionally, investment in residential real estate declined by 5.1% in the third quarter.4

There was no Federal Open Market Committee (FOMC) meeting in October; however, minutes from the September 18 meeting were released on October 9. The minutes revealed a “robust debate” over the size of the September rate cut, though the 11-to-1 vote casts doubt on just how robust this debate truly was.5,6,7 Markets continue to anticipate a total of 0.5% in rate cuts by year end, implying a 0.25% cut at each of the remaining FOMC meetings, the next of which is scheduled for November 7.8 By the end of October, markets were pricing in an additional 1.0% in rate cuts through the end of 2025.8
October marked the beginning of the third-quarter earnings season, and 70% of S&P 500 companies had reported earnings by the end of the month. Current estimates indicate that S&P 500 earnings grew by 3.6% year over year in the third quarter, driven by strong performances in the technology (16.0%), communication services (11.5%), and financial (5.7%) sectors.9 The “Magnificent Seven”—Amazon, Apple, Alphabet, Microsoft, Meta, Tesla, and Nvidia—are expected to report an impressive 18.1% year-over-year earnings growth for the quarter. Excluding these seven companies, the remaining 493 S&P 500 companies would report only 0.1% year-over-year earnings growth for the period.10 Earnings growth for both the Magnificent Seven and the remaining 493 companies is projected to be in double digits over the next five quarters.10 For 2024, overall S&P 500 earnings growth is expected to rise by 9.3%.
The American Dream
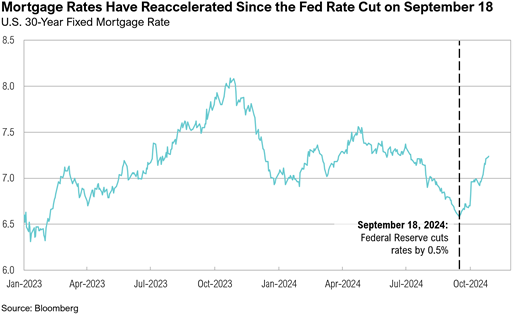
The relatively elevated interest rate environment of the past few years has weighed heavily on the U.S. housing market. Hopeful homebuyers’ purchasing power plummeted as mortgage rates increased in late 2023 to their highest level in over 20 years. Although mortgage rates declined to 6.5%—the lowest since February 2023—in the days leading up to the Federal Reserve’s anticipated rate reduction on September 18, this reprieve was short lived. Rates climbed higher throughout October, and the 30-year fixed mortgage rate ended the month at 7.24%, the highest since early July 2024. Similarly, U.S. Treasury yields ended October at 4.2%, marking their highest level since late July 2024.

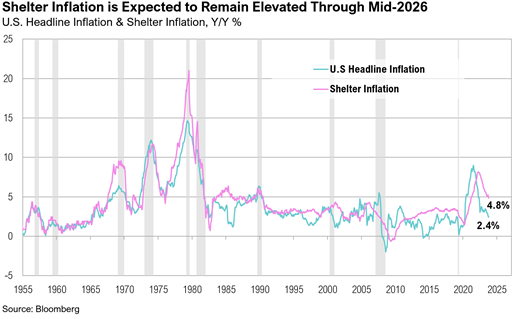
- Mortgage rates tend to follow longer-term Treasury yields. Today, yields are rising partly due to the growing U.S. fiscal deficit, which ended the 2024 fiscal year at $1.8 trillion and is now the largest deficit on record in a non-crisis year and the third largest in U.S. history. In addition, stronger-than-expected inflation and labor market data have also pushed 10-year Treasury yields higher, and mortgage rates have followed suit.Driven by imbalances in supply and demand, house prices are elevated. The average price of a home sold in the U.S. reached $501,100 in the third quarter.11 Although this marks a decrease from the record high of $525,100 in the second quarter of 2022, it remains more than 30% above pre-pandemic trends.11 The National Association of Realtors’ housing affordability index stood at 98.6—40% below the 40-year average of 137—indicating that a median-income family has less than the income required to afford a median-priced home.12Existing home sales are on track for their worst year since 1995, as elevated prices and mortgage rates deter potential buyers.13 Approximately two-thirds of existing home loans have mortgage rates of 4% or less, making homeowners reluctant to sell and give up their favorable rates, thus limiting the supply of existing homes on the market.13,14 In September, existing home sales fell by 1% from the prior month to 3.84 million, reaching the lowest monthly rate since October 2010.13,15 New home construction has also declined from a peak of 1.8 million units in April 2022 to 1.35 million in September. According to David Auld, the CEO of D.R. Horton, one of the largest U.S. homebuilder companies:“While mortgage rates have decreased from their highs earlier this year, many potential homebuyers expect rates to be lower in 2025. We believe that rate volatility and uncertainty are causing some buyers to stay on the sidelines…”16Renters also face higher costs. Rent prices increased by 3.3% year over year in September, rising in 49 of the 50 largest metro areas. Rent remains 34% higher than pre-pandemic levels, and the shelter component of inflation (at 4.8% year over year) continues to outpace the overall headline inflation rate (at 2.4% year over year).17,18,19

The Cleveland Federal Reserve recently examined why rent inflation remains elevated at 4.8% year-over-year. The study found that during the COVID-19 pandemic, new tenant rent inflation surged and then later declined. Overall rent inflation, which includes both new and continuing tenants, increased more slowly and remains high, however. This persistence is largely due to smaller rent increases for continuing tenants, resulting in a notable “rent gap” of 5.5% as of the end of September.20 The paper projects that rent inflation will likely stay above pre-pandemic levels (and average around 3.5%) until mid-2026.20 Rent inflation is expected to play a significant role in dictating the final phase of reducing inflation, due to shelter’s substantial weight in the overall inflation calculation (36.5%) and the concerns that recent inflation trends could reverse.19 Rising long-term Treasury yields may reflect worries that the Federal Reserve has underestimated the risk that inflation could remain above its 2% target or increase even further.
Markets
Not one equity asset class finished October with positive returns. U.S. large-cap stocks declined by 0.9%, while U.S. small-cap stocks declined by 1.4%. International equity markets performed worse. Developed market stocks fell 5.4% and developed market small-cap stocks decreased 6.3%. Emerging and frontier markets also struggled, ending the month down 4.3%. Despite September’s interest rate cut, Treasury yields climbed throughout October. U.S. intermediate-term bonds fell by 2.5%, and rate-sensitive U.S. REITs ended the month down 2.9%.
October was an interesting month for commodities. After climbing to $77.7 per barrel on October 10 amid rising Middle East tensions, West Texas Intermediate (WTI) crude fell $7 to close the month at $70.6 It dropped 5.8% on October 25—the steepest one-day decline since the onset of the Israel-Hamas conflict on October 7, 2023. Elsewhere in commodities markets, palladium surged 12.5% after news of U.S. sanctions on top producer Russia, and gold prices rose by 4.9%.21

On October 18, China released its third-quarter GDP estimate, which came in at 4.6% year over year—the slowest pace of economic growth in six quarters and below the country’s 5% growth target.22 Following the release, the People’s Bank of China rolled out two stock-funding schemes worth $112 billion, including a $42 billion financing program intended for stock buybacks.22 The MSCI China Index ended October down 5.9% but is up 21.7% year-to-date.
The Japanese yen weakened against the dollar in the closing days of October after a snap election revealed no majority party emerging.23,24 The yen closed the month at ¥153. The Bank of Japan kept interest rates unchanged at its October 31 monetary policy meeting, citing election uncertainty.24 The MSCI Japan ended October down 3.9%.
Looking Forward
Investors continue to face ambiguity around interest rates, the deficit, and the recent election. Policymakers seem content with decisions that prioritize the here and now at the expense of long-term fiscal stability, thereby limiting their ability to respond to future crises and threatening the role of the U.S. dollar in global trade. Given this landscape, we maintain that diversification should include healthy exposures to risk, minimal longer-term bonds, and hedges against policies that will result in the continued erosion of purchasing power.
Disclosures
Advisory Persons of Thrivent Advisor Network provide advisory services under a “doing business as” name or may have their own legal business entities. However, advisory services are engaged exclusively through Thrivent Advisor Network, LLC, a registered investment adviser. Cedar Cove Wealth Partners and Thrivent Advisor Network, LLC are not affiliated companies.
Securities offered through Thrivent Investment Management Inc. (“TIMI”), member FINRA and SIPC, and a subsidiary of Thrivent, the marketing name for Thrivent Financial for Lutherans. Thrivent.com/disclosures. TIMI and Cedar Cove Wealth Partners are not affiliated companies.
The material presented includes information and opinions provided by a party not related to Thrivent Advisor Network. It has been obtained from sources deemed reliable; but no independent verification has been made, nor is its accuracy or completeness guaranteed. The opinions expressed may not necessarily represent those of Thrivent Advisor Network or its affiliates. They are provided solely for information purposes and are not to be construed as solicitations or offers to buy or sell any products or services. They also do not include all fees or expenses that may be incurred by investing in specific products. Performance is no guarantee of future results. Investments will fluctuate and when redeemed may be worth more or less than when originally invested and cannot invest directly in an index. Opinions expressed are subject to change as subsequent conditions vary. Thrivent Advisor Network and its affiliates accept no liability for loss or damage of any kind arising from the use of this information.
Index Benchmarks presented within this report may not reflect factors relevant for your portfolio or your unique risks, goals or investment objectives. Past performance of an index is not an indication or guarantee of future results. It is not possible to invest directly in an index.
The Bloomberg U.S. Aggregate Bond® Index, or the Agg, is a broad base, market capitalization-weighted bond market index representing intermediate term investment grade bonds traded in the United States. Investors frequently use the index as a stand-in for measuring the performance of the U.S. bond market.
The Consumer Price Index (CPI) is a measure of the average change over time in the prices paid by urban consumers for a market basket of consumer goods and services.
The MSCI (Morgan Stanley Capital International) China® Index captures large and mid-cap representation across China A shares, H shares, B shares, Red chips, P chips and foreign listings (e.g. ADRs). With 717 constituents, the index covers about 85% of this China equity universe.
The MSCI EAFE® (Morgan Stanley Capital International Europe, Australasia, and the Far East) Index is a broad market index of stocks located within countries in Europe, Australasia, and the Middle East.
The MSCI (Morgan Stanley Capital International) South Africa Index is designed to measure the performance of the large and mid-cap segments of the South African market. With 37 constituents, the index covers approximately 85% of the free float-adjusted market capitalization in South Africa.
The Russell 2000® Index measures the performance of the 2,000 smaller companies that are included in the Russell 3000® Index, which itself is made up of nearly all U.S. stocks. The Russell 2000® is widely regarded as a bellwether of the U.S. economy because of its focus on smaller companies that focus on the U.S. market.
The S&P 500® Index, or the Standard & Poor’s 500® Index, is a market-capitalization-weighted index of the 500 largest U.S. publicly traded companies.
West Texas Intermediate Index (WTI) is the main oil benchmark for North America as it is sourced from the United States, primarily from the Permian Basin. The oil comes mainly from Texas.
Definitions
The Bureau of Economic Analysis (BEA) is an agency of the Department of Commerce that produces economic accounts statistics that enable government and business decision-makers, researchers, and the American public to follow and understand the performance of the nation’s economy. To do this, BEA collects source data, conducts research and analysis, develops and implements estimation methodologies, and disseminates statistics to the public.
The Bureau of the Fiscal Service (BFS) is a United States Department of the Treasury agency that manages the federal government’s account, collections, payments, and public debts.
The Bureau of Labor Statistics (BLS) is an agency of the United States Department of Labor. It is the principal fact-finding agency in the broad field of labor economics and statistics and serves as part of the U.S. Federal Statistical System. BLS collects, calculates, analyzes, and publishes data essential to the public, employers, researchers, and government organizations.
Basis points are typically expressed with the abbreviations bp, bps, or bips. A basis point is a common unit of measure for interest rates and other percentages in finance. One basis point is equal to 1/100th of 1%, or 0.01%. In decimal form, one basis point appears as 0.0001 (0.01/100).
Capitalization (Cap) is used to describe the size of the company, by market capitalization as follows:
- mega-cap: market value of $200 billion or more.
- large cap: market value between $10 billion and $200 billion.
- mid-cap: market value between $2 billion and $10 billion.
- small cap: market value between $250 million and $2 billion.
- micro-cap: market value of less than $250 million.
The CME FedWatch Tool is a tool created by the CME Group (Chicago Mercantile Exchange Group) to act as a barometer for the market’s expectation of potential changes to the fed funds target rate while assessing potential Fed movements around Federal Open Market Committee (FOMC) meetings.
The Federal Open Market Committee (FOMC) is the branch of the Federal Reserve System that determines the direction of monetary policy. The FOMC has 12 voting members, including all seven members of the Board of Governors and a rotating group of five Reserve Bank presidents. The Chair of the Board of Governors also serves as Chair of the FOMC.
FRED (Federal Reserve Economic Data) is an online database consisting of hundreds of thousands of economic data time series from scores of national, international, public, and private sources.
Gross domestic product (GDP) is the total monetary or market value of all the finished goods and services produced within a country’s borders in a specific time period. As a broad measure of overall domestic production, it functions as a comprehensive scorecard of a given country’s economic health.
Performance Disclosures
All market pricing and performance data from Bloomberg, unless otherwise cited. Asset class and sector performance are gross of fees unless otherwise indicated.
Citations
-
- BLS: https://www.bls.gov/news.release/cpi.nr0.htm
- BLS: https://www.bls.gov/news.release/empsit.nr0.htm
- Federal Reserve Bank of St. Louis: https://fred.stlouisfed.org/series/IC4WSA
- BEA: https://www.bea.gov/sites/default/files/2024-10/gdp3q24-adv.pdf
- Federal Reserve: https://www.federalreserve.gov/monetarypolicy/files/fomcminutes20240918.pdf
- Bloomberg: https://www.bloomberg.com/news/articles/2024-10-09/fed-minutes-show-robust-debate-about-size-of-september-rate-cut
- CNBC: https://www.cnbc.com/2024/10/09/fed-officials-were-divided-on-whether-to-cut-rates-by-half-a-point-in-september-minutes-show.html
- CME FedWatch: https://www.cmegroup.com/markets/interest-rates/cme-fedwatch-tool.html
- FactSet: https://advantage.factset.com/hubfs/Website/Resources%20Section/Research%20Desk/Earnings%20Insight/EarningsInsight_102524.pdf
- FactSet: https://insight.factset.com/are-the-magnificent-7-companies-top-contributors-to-earnings-growth-for-the-sp-500-for-q3
- Federal Reserve Bank of St. Louis: https://fred.stlouisfed.org/series/ASPUS
- National Association of Realtors: https://www.nar.realtor/research-and-statistics/housing-statistics/housing-affordability-index
- Wall Street Journal: https://www.wsj.com/economy/housing/home-sales-on-track-for-worst-year-since-1995-9a2029ae
- Financial Times: https://www.ft.com/content/2e8ba518-65f8-4837-a743-2f1c132ebaf6
- National Association of Realtors: https://www.nar.realtor/research-and-statistics/housing-statistics/existing-home-sales
- Seeking Alpha: https://seekingalpha.com/article/4730459-d-r-horton-inc-dhi-q4-2024-earnings-call-transcript?source=generic_rss
- Zillow: https://www.zillow.com/research/september-2024-rent-report-34516/
- NerdWallet: https://www.nerdwallet.com/article/finance/rental-market-trends
- BLS: https://www.bls.gov/news.release/cpi.t01.htm
- Federal Reserve Bank of Cleveland: https://www.clevelandfed.org/publications/economic-commentary/2024/ec-202417-new-tenant-rent-passthrough-and-future-of-rent-inflation
- Mining.com: https://www.mining.com/web/palladium-price-jumps-after-us-suggests-sanctions-on-russian-exports/
- Reuters: https://www.reuters.com/world/china/china-kicks-off-112-billion-funding-schemes-support-stock-market-2024-10-18/
- Reuters: https://www.reuters.com/world/asia-pacific/japans-government-flux-after-election-gives-no-party-majority-yen-hit-2024-10-28/
- Reuters: https://www.reuters.com/markets/asia/boj-keep-rates-steady-politics-muddles-outlook-2024-10-30/