
Market Commentary
Rain on the Parade
February 2025
Summary
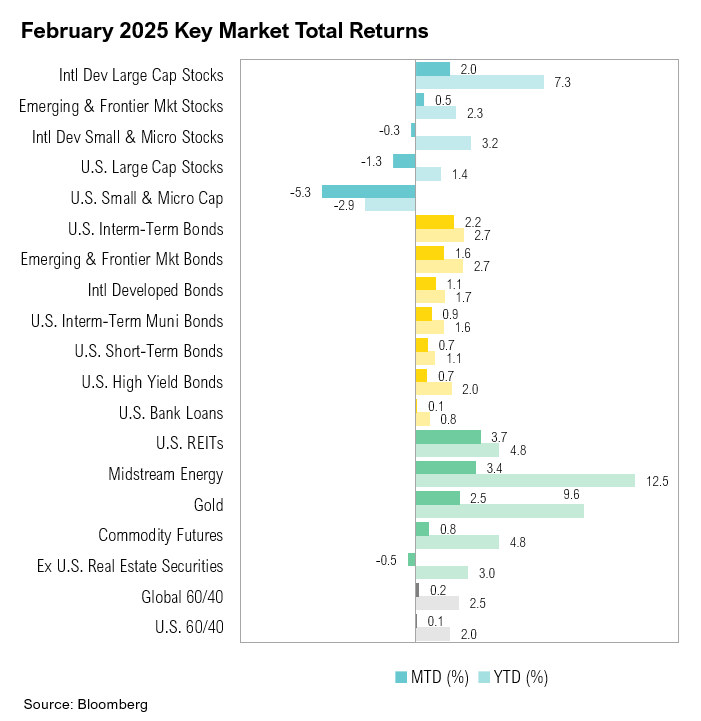
- Market results were mixed in February. U.S. large-cap stocks ended the month down 1.3%, and U.S. small-cap stocks declined 5.3% while U.S. intermediate-term bonds gained 2.2%.
- Consumer spending declined, but wages increased. Inflation remains persistently elevated.
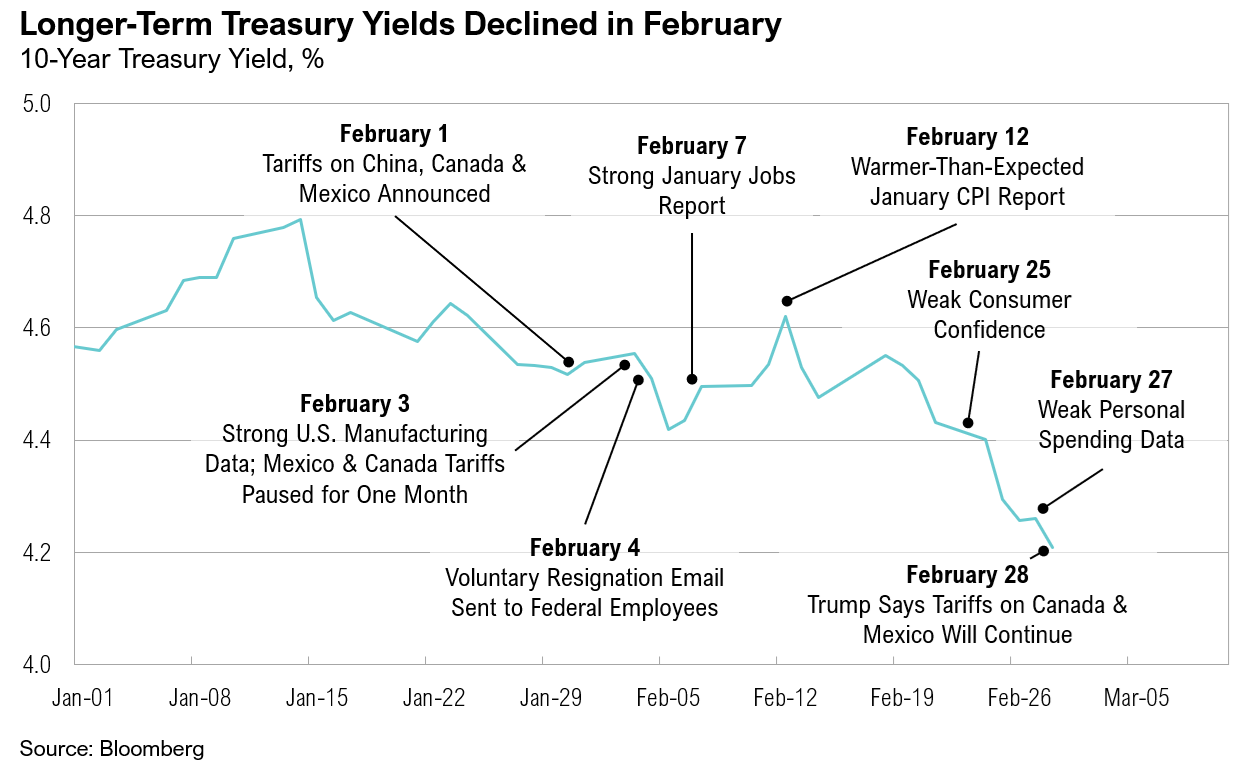
- It remains unclear how much of the decline in bond yields signals optimism about the Department of Government
- Efficiency’s impact on the deficit versus concerns over a growth slowdown caused by tariffs.
- Treasury Secretary Scott Bessent is urging markets and consumers to bear the short-term pain of government spending cuts and tariffs for long-term gains stemming from the anticipated boost in domestic manufacturing and capital investment.
Overview
Markets produced mixed results in February. U.S. large-cap stocks, as represented by the S&P 500, ended the month down 1.3%, while the U.S. small-cap Russell 2000 Index ended February down 5.3%. U.S. intermediate-term bonds fared well, as the Bloomberg U.S. Aggregate Bond Index gained 2.2%.
Personal income increased by 0.9%, driven by rising wages and adjustments to social security benefits.1 Higher income and lower spending boosted the personal savings rate, which climbed to a six-month high of 4.6% in January.2 Consumer prices ticked up in the first month of the year. The January consumer price index (CPI) report showed headline inflation rising to 3.0% year-over-year, while core inflation also increased, rising to 3.3%. Persistent inflation and unseasonably cold weather weighed on consumer spending as retail sales declined by 0.9% month-over-month in January.
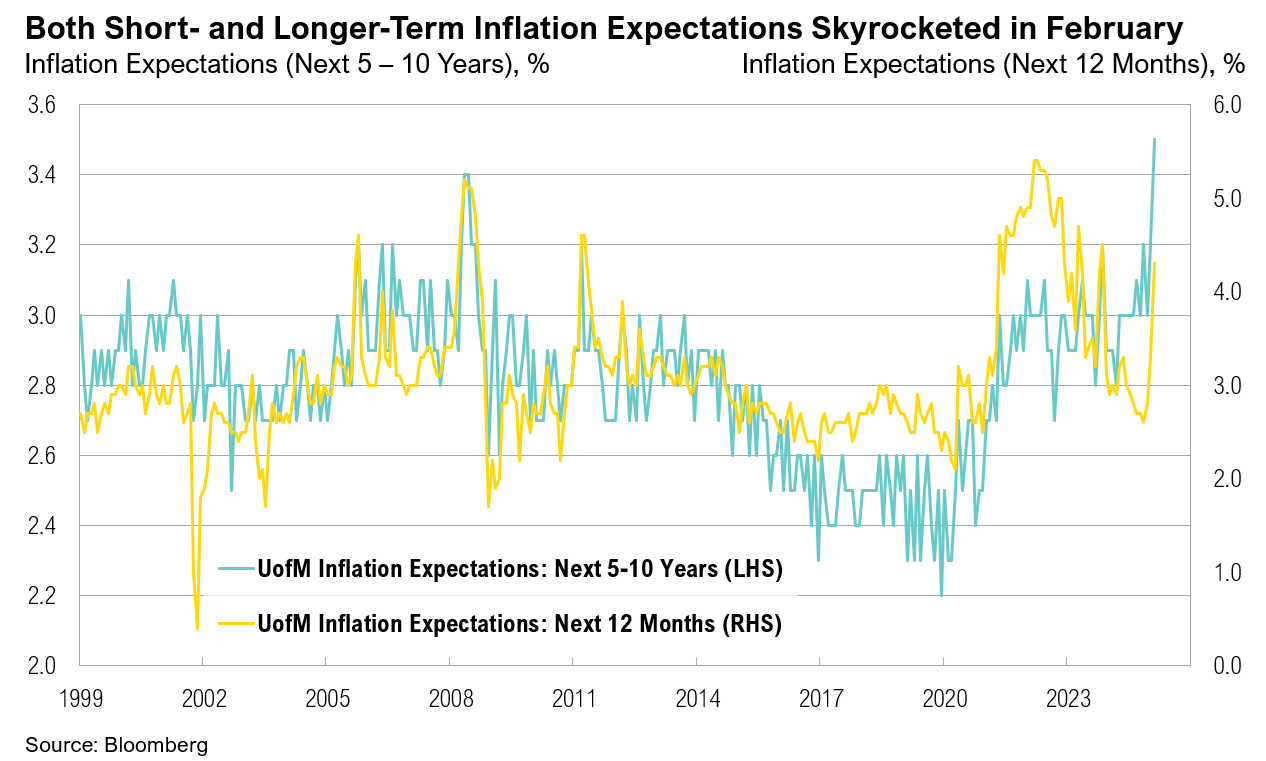
Largely due to the warmer-than-anticipated January inflation report and tariff concerns, inflation expectations rose sharply in February. Longer-term inflation expectations reached a record 3.5%, while short-term (next 12 months) expectations jumped by 1%, rising to 4.3%. This is more than double the official Federal Reserve target of 2%. Minutes from the January 29 Federal Open Market Committee (FOMC) meeting, released on February 19, showed Fed officials willing to hold interest rates steady amid stubborn inflation and uncertainty surrounding economic policy.3
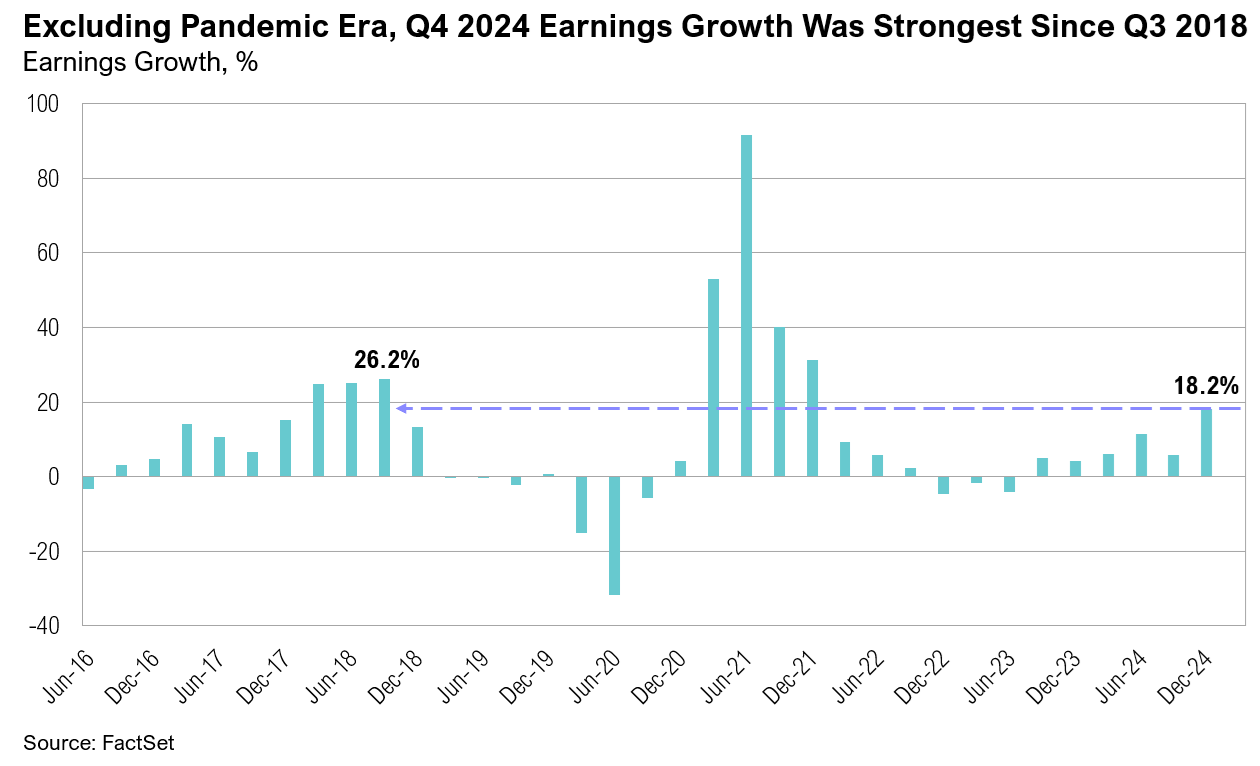
With over 97% of S&P 500 companies having already reported, earnings growth for the fourth quarter of 2024 notably improved over February, rising from 11.7% at the start of the year to 18.2%.4 Excluding the COVID-19 pandemic, this represents the strongest quarterly earnings growth for the S&P 500 since the third quarter of 2018, when earnings grew by 26%. Financials (56%), communication services (30%) and consumer discretionary (27%) led the earnings growth.4 Looking ahead, projections for the first-quarter S&P 500 earnings growth are expected to be 7.5%.4
Rain on the Parade
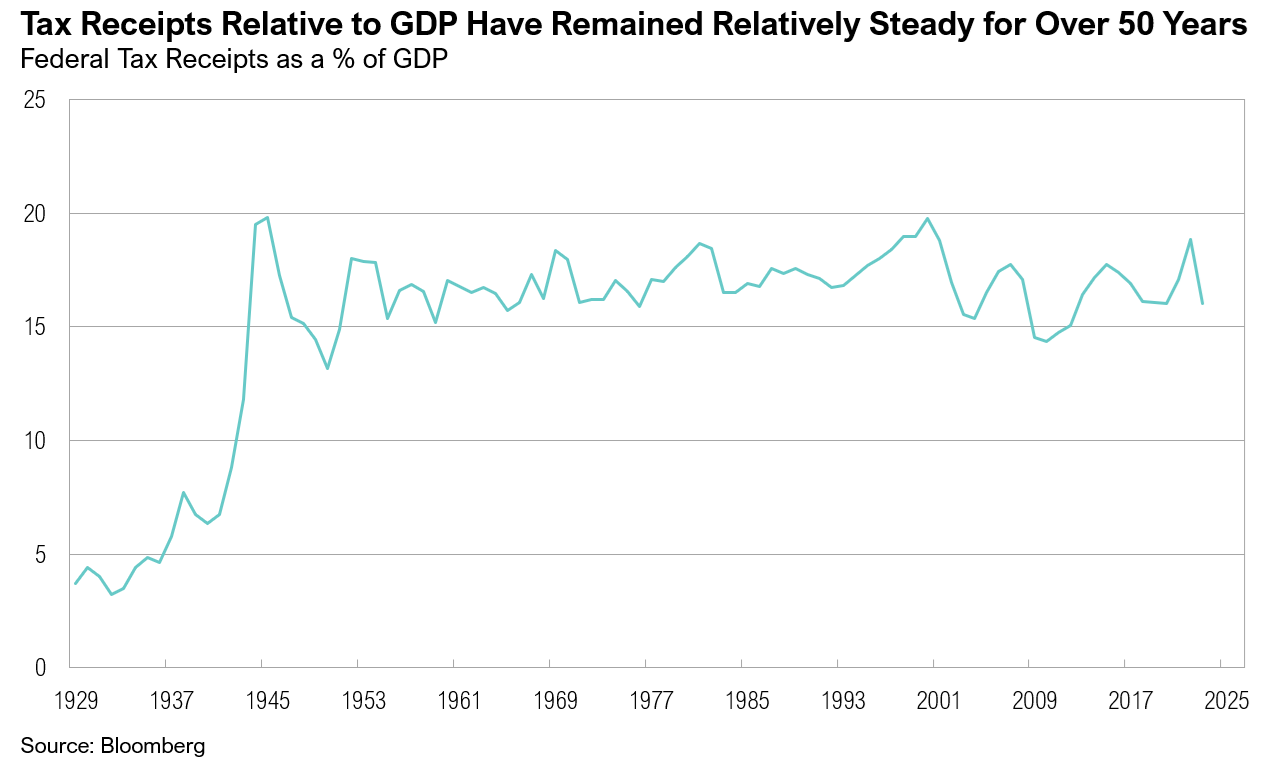
The U.S. government fiscal deficit reached $1.8 trillion in the 2024 fiscal year, making it the largest deficit on record for a non-crisis or non-recessionary year. Already, the fiscal deficit for 2025 has surpassed $800 billion, and is projected to reach $1.9 trillion by the fiscal year end.5,6 Tax receipts as a percentage of GDP have remained steady for over 50 years—but government spending has not. In the words of new Treasury Secretary Scott Bessent: “We do not have a revenue problem in the U.S. We have a spending problem.”7
In December, Fed Chair Jerome Powell noted that:
“The U.S. federal budget is on an unsustainable path. The debt is not at an unsustainable level, but the path is unsustainable, and we know that we have to change that.”8
The Trump administration has made it clear that reducing the fiscal deficit is one of its primary objectives. The newly created Department of Government Efficiency, or DOGE, was created to improve government accountability and efficiency through strategic oversight and reform initiatives. DOGE’s methods thus far have, at times, been unorthodox, including a parade of often controversial decisions. For example, it offered a “deferred resignation,” which approximately 75,000 federal employees accepted in exchange for up to six months of paid leave. It also fired and re-hired essential Department of Agriculture employees to work on the government’s response to the ongoing bird flu outbreak in the U.S. and stopping nearly all funding from USAID.9,10,11,12,13 DOGE claims to have saved the government over $100 billion already.14
Nevertheless, progress has at least been made in shedding light on wasteful government spending. Further, a recent Harvard CAPS-Harris poll of over 2,400 registered U.S. voters found an overwhelming support for the government’s policies on eliminating fraud and waste in government spending and cutting government expenditures that were already allocated by Congress.15 77% of Americans believe that a full examination of government expenditures is needed, and 83% of Americans (including 72% of Democrats and 94% of Republicans) agreed that spending should be cut.15
The poll also found broad support for “placing reciprocal tariffs on countries that have tariffs on U.S. goods.”15 On February 1, President Trump signed executive orders imposing 25% tariffs on imports from Canada and Mexico and a 10% tariff on imports from China. Following the announcement, tariffs were temporarily paused for one month after both Canada and Mexico agreed to tighten border security to curb the flow of illegal drugs into the U.S.16,17 In early March, the temporary pause was lifted, and an additional 10% tariff was added to Chinese goods.18,19
While the secondary GDP estimate showed economic growth holding steady at an annualized 2.3%, concerns about slowing growth increased over the month, as trade policy uncertainty rained on the parade of continued economic expansion. The Atlanta Fed’s GDPNow estimate for the first quarter of 2025 sharply dropped from 2.9% in the beginning of February, to end the month at -1.5%.20 A key reason for the sharp decline was a notable increase in U.S. trade deficits as imports surged in an effort to avoid forthcoming tariffs.21 Notably, a substantial portion of import gains was driven by the movement of gold from Europe to the U.S. to avoid tariffs.22
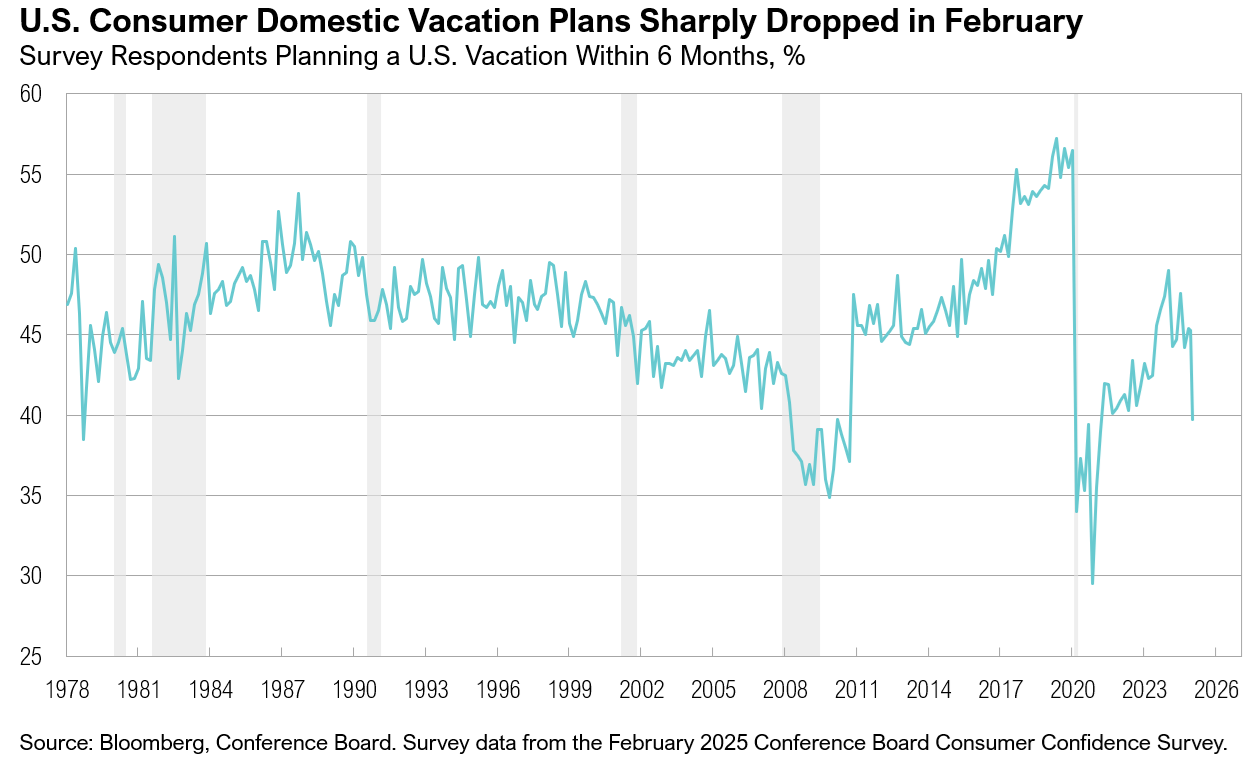
Consumer confidence also dropped by seven points in February, recording the largest monthly decline since August 2021 as pessimism about the future returned.23 The number of consumers planning a vacation in the next six months plummeted by 6%, the largest monthly drop outside of the COVID-19 pandemic. Reports show that corporate capital spending plans have started to reverse, as uncertainty on the economic outlook grows.24 The American Association of Individual Investors (AAII) sentiment survey showed bearish sentiment rising to 61% in the last week of February, despite nearly 40% of respondents saying that the current state of the economy was “good” and the S&P 500 ending the month 3% off its all-time high.25
Bond yields declined throughout February, easing from 4.5% to end the month at 4.2%. Whether or not declining bond yields reflect potential optimism about DOGE’s impact and its ability to trim the fiscal deficit or whether they reflect rising concerns about a possible growth slowdown remains to be seen. Credit spreads remain tight—and continue to signal economic stability and the potential for continued expansion.
The Trump administration is urging markets to overlook the short-term pain of deficit cuts and potential tariff consequences, focusing instead on the expected boost in small business spending, domestic manufacturing, and capital investment. As Treasury Secretary Bessent pointed out:
“Wall Street can continue to do fine. But we have a focus on small business and the consumers. So we are going to rebalance the economy. We’re going to bring manufacturing jobs home.”26
For now, these anticipated benefits appear to be overshadowed by the immediate effects of deficit reductions and tariffs.
Markets
For the second consecutive month, international equities fared better than their U.S. counterparts. U.S. large-cap stocks ended the month down 1.3% while international developed large cap stocks gained 2.0%. Similarly, while U.S. small-cap stocks ended the month down 5.3%, international developed market small cap stocks declined by only 0.3%. International developed market gains were driven mostly by European countries, including Spain (+10%), Poland (+8%) and Finland (+4%). U.S. intermediate-term bonds ended February up 2.2%, while developed market bonds gained 1.1%.
In international news, Chinese markets ended February up nearly 12%, despite tariff concerns. Recent reports suggest a potential shift in Beijing’s approach to the private sector, as Chinese President Xi Jinping hosted a high-profile meeting with top entrepreneurs, including representatives from DeepSeek and Alibaba founder Jack Ma, amongst others. The meeting fueled speculation about a possible revival of China’s technology industry and renewed support for private enterprises.27
Looking Forward
The current administration aims to reduce the deficit to extend the Tax Cuts and Jobs Act beyond its scheduled expiration at the end of 2025. It has also proposed eliminating income taxes on Social Security benefits, overtime and tips, which would reduce government revenue by $1.8 trillion over the next ten years.28,29 Achieving these objectives requires curtailing government spending to keep longer-term interest rates contained, in hopes of sustaining the current economic expansion.
The administration is encouraging markets to look beyond the near-term pain posed by deficit cuts and tariff consequences, focusing instead on the potential boost in small business spending, domestic manufacturing, and capital investment that may result. As long as markets see sufficient evidence that this approach is working, broader disruptions may remain contained. However, if these efforts falter, the parade may be called off.
Citations
- Reuters: https://www.reuters.com/markets/us/us-consumer-spending-falls-january-monthly-inflation-rises-2025-02-28/
- FRED: https://fred.stlouisfed.org/series/PSAVERT
- Federal Reserve: https://www.federalreserve.gov/monetarypolicy/files/fomcminutes20250129.pdf
- FactSet: https://advantage.factset.com/hubfs/Website/Resources%20Section/Research%20Desk/Earnings%20Insight/EarningsInsight_022825.pdf
- Bureau of the Fiscal Service: https://www.fiscal.treasury.gov/files/reports-statements/mts/mts0125.pdf
- Congressional Budget Office: https://www.cbo.gov/system/files/2024-06/60039-By-the-Numbers.pdf
- CNBC: https://www.cnbc.com/video/2025/01/16/scott-bessent-we-have-a-spending-problem-in-the-u-s-not-a-revenue-problem.html
- The Hill: https://thehill.com/business/5022592-federal-reserve-warns-unsustainable-path/
- Bloomberg: https://www.bloomberg.com/news/articles/2025-01-29/trump-s-federal-worker-buyout-is-actually-deferred-resignation
- CNBC: https://www.cnbc.com/2025/02/13/trump-administration-tells-federal-agencies-to-fire-probationary-employees.html
- AP News: https://apnews.com/article/doge-firings-layoffs-federal-government-workers-musk-d33cdd7872d64d2bdd8fe70c28652654
- Reuters: https://www.reuters.com/business/healthcare-pharmaceuticals/services-collapsing-usaid-cuts-health-contracts-worldwide-2025-02-27/
- Washington Times: https://www.washingtontimes.com/news/2025/feb/19/agriculture-department-tries-rehire-fired-workers-link-bird-flu-respon/
- Department of Government Efficiency: https://www.doge.gov/savings
- Harvard CAPS-Harris Poll: https://harvardharrispoll.com/wp-content/uploads/2025/02/HHP_Feb2025_vFinal.pdf
- AP News: https://apnews.com/article/trump-tariffs-canada-mexico-china-sheinbaum-trudeau-017efa8c3343b8d2a9444f7e65356ae9
- Reuters: https://www.reuters.com/world/us/trump-says-americans-may-feel-pain-trade-war-with-mexico-canada-china-2025-02-03/
- Forbes: https://www.forbes.com/sites/mollybohannon/2025/02/24/trump-says-tariffs-on-mexico-and-canada-will-go-forward-next-month/
- Wall Street Journal: https://www.wsj.com/politics/policy/trump-plans-another-10-tariff-on-products-from-china-f7c0d4d9
- Federal Reserve Bank of Atlanta: https://www.atlantafed.org/cqer/research/gdpnow
- Bloomberg: https://www.bloomberg.com/news/articles/2025-03-06/us-trade-deficit-surges-to-a-record-ahead-of-trump-tariffs
- Bloomberg: https://www.bloomberg.com/news/articles/2025-01-30/swiss-gold-exports-to-us-surged-last-month-on-trump-tariff-fears
- Conference Board: https://www.conference-board.org/topics/consumer-confidence
- Apollo Academy: https://www.apolloacademy.com/short-term-pain-long-term-gain/
- AAII: https://www.aaii.com/sentimentsurvey
- Yahoo Finance: https://finance.yahoo.com/news/wall-street-fine-focused-main-161041025.html
- South China Morning Post: https://www.scmp.com/economy/china-economy/article/3299019/xi-jinping-backs-chinas-private-sector-meeting-entrepreneurs
- Penn Wharton: https://budgetmodel.wharton.upenn.edu/issues/2025/2/10/eliminating-income-taxes-on-social-security-benefits
- Tax Foundation: https://taxfoundation.org/research/all/federal/tax-cuts-and-jobs-act-tcja-permanent-analysis/
Asset Class Definitions
Asset class performance was measured using the following benchmarks: U.S. Large Cap Stocks: S&P 500 TR Index; U.S. Small & Micro Cap: Russell 2000 TR Index; Intl Dev Large Cap Stocks: MSCI EAFE GR Index; Emerging & Frontier Market Stocks: MSCI Emerging Markets GR Index; U.S. Interm-Term Muni Bonds: Bloomberg 1-10 (1-12 Yr) Muni Bond TR Index; U.S. Interm-Term Bonds: Bloomberg U.S. Aggregate Bond TR Index; U.S. High Yield Bonds: Bloomberg U.S. Corporate High Yield TR Index; U.S. Bank Loans: Morningstar LSTA US LL TR Index; Intl Developed Bonds: Bloomberg Global Aggregate ex-U.S. Index; Emerging & Frontier Market Bonds: Bloomberg EM USD Aggregate TR Index; U.S. REITs: MSCI U.S. REIT GR Index, Ex U.S. Real Estate Securities: S&P Global Ex-U.S. Property TR Index; Commodity Futures: Bloomberg Commodity TR Index; Midstream Energy: Alerian MLP TR Index; Gold: LBMA Gold Price, U.S. 60/40: 60% S&P 500 TR Index; 40% Bloomberg U.S. Aggregate Bond TR Index; Global 60/40: 60% MSCI ACWI GR Index; 40% Bloomberg Global Aggregate Bond TR Index.
Disclosures & Definitions
Advisory Person(s) may use proprietary financial planning tools, calculators and third-party tools and materials (“Third-Party Materials”) to develop your financial planning recommendations. The projections or other information generated by Third-Party Materials regarding the likelihood of various investment outcomes are hypothetical in nature, do not reflect actual investment results, and are not guarantees of future results. Results may vary with each use and over time. Thrivent Advisor Network, LLC and its advisors do not provide legal, accounting or tax advice. Consult your attorney and or tax professional regarding these situations.
The return assumptions in Third-Party Materials are not reflective of any specific product, and do not include any fees or expenses that may be incurred by investing in specific products. The actual returns of a specific product may be more or less than the returns used. It is not possible to directly invest in an index. Financial forecasts, rates of return, risk, inflation, and other assumptions may be used as the basis for illustrations. They should not be considered a guarantee of future performance or a guarantee of achieving overall financial objectives. Past performance is not a guarantee or a predictor of future results of either the indices or any particular investment. Investing involves risks, including the possible loss of principal.
Advisory Persons of Thrivent Advisor Network provide advisory services under a “doing business as” name or may have their own legal business entities. However, advisory services are engaged exclusively through Thrivent Advisor Network, LLC, a registered investment adviser. Cedar Cove Wealth Partners and Thrivent Advisor Network, LLC are not affiliated companies.
Securities offered through Thrivent Investment Management Inc. (“TIMI”), member FINRA and SIPC, and a subsidiary of Thrivent, the marketing name for Thrivent Financial for Lutherans. Thrivent.com/disclosures. TIMI and Cedar Cove Wealth Partners are not affiliated companies.
The material presented includes information and opinions provided by a party not related to Thrivent Advisor Network. It has been obtained from sources deemed reliable; but no independent verification has been made, nor is its accuracy or completeness guaranteed. The opinions expressed may not necessarily represent those of Thrivent Advisor Network or its affiliates. They are provided solely for information purposes and are not to be construed as solicitations or offers to buy or sell any products or services. They also do not include all fees or expenses that may be incurred by investing in specific products. Performance is no guarantee of future results. Investments will fluctuate and when redeemed may be worth more or less than when originally invested and cannot invest directly in an index. Opinions expressed are subject to change as subsequent conditions vary. Thrivent Advisor Network and its affiliates accept no liability for loss or damage of any kind arising from the use of this information.
This communication may include forward looking statements. Specific forward-looking statements can be identified by the fact that they do not relate strictly to historical or current facts and include, without limitation, words such as “may,” “will,” “expects,” “believes,” “anticipates,” “plans,” “estimates,” “projects,” “targets,” “forecasts,” “seeks,” “could’” or the negative of such terms or other variations on such terms or comparable terminology. These statements are not guarantees of future performance and involve risks, uncertainties, assumptions and other factors that are difficult to predict and that could cause actual results to differ materially.
Any specific securities identified and described do not represent all of the securities purchased, sold, or recommended for advisory clients. The reader should not assume that investments in the securities identified and discussed were or will be profitable. A summary description of the principal risks of investing in a particular model is available upon request. There can be no assurance that a model will achieve its investment objectives. Investment strategies employed by the advisor in selecting investments for the model portfolio may not result in an increase in the value of your investment or in overall performance equal to other investments. The model portfolio’s investment objectives may be changed at any time without prior notice. Portfolio allocations are based on a model portfolio, which may not be suitable for all investors. Clients should also consider the transactions costs and/or tax consequences that might result from rebalancing a model portfolio. Frequent rebalancing may incur additional costs and/or tax consequences versus less rebalancing. Please notify us if there have been any changes to your financial situation or your investment objectives, or if you would like to place or modify any reasonable restrictions on the management of your account.
Index Benchmarks presented within this report may not reflect factors relevant for your portfolio or your unique risks, goals or investment objectives. Past performance of an index is not an indication or guarantee of future results. It is not possible to invest directly in an index.
The Alerian MLP Index is the leading gauge of energy infrastructure Master Limited Partnerships (MLPs). The capped, float-adjusted, capitalization-weighted index, whose constituents earn the majority of their cash flow from midstream activities involving energy commodities, is disseminated real-time on a price-return basis (AMZ) and on a total-return basis (AMZX).
The Bloomberg Commodity® Index (BCOM) is a broadly diversified commodity price index distributed by Bloomberg Index Services Limited.
The Bloomberg EM (Emerging Markets) USD Aggregate Index® is a flagship hard currency Emerging Markets debt benchmark that includes fixed and floating-rate U.S. dollar-denominated debt issued from sovereign, quasi-sovereign, and corporate EM issuers.
The Bloomberg Global Aggregate® Index is a flagship measure of global investment grade debt from twenty-four local currency markets. This multi-currency benchmark includes treasury, government-related, corporate and securitized fixed-rate bonds from both developed and emerging markets issuers.
The Bloomberg Global Aggregate ex USD Index is a measure of investment grade debt from 24 local currency markets. This multi-currency benchmark includes treasury, government-related, corporate and securitized fixed-rate bonds from both developed and emerging markets issuers. Bonds issued in USD are excluded.
The Bloomberg U.S. Aggregate Bond® Index, or the Agg, is a broad base, market capitalization-weighted bond market index representing intermediate term investment grade bonds traded in the United States. Investors frequently use the index as a stand-in for measuring the performance of the U.S. bond market.
The Bloomberg U.S. Corporate High Yield Bond® Index measures the USD-denominated, high yield, fixed-rate corporate bond market. Securities are classified as high yield if the middle rating of Moody’s, Fitch and S&P is Ba1/BB+/BB+ or below.
The Consumer Price Index (CPI) is a measure of the average change over time in the prices paid by urban consumers for a market basket of consumer goods and services.
The LBMA (London Bullion Market Association ) Gold Price Index measures the performance of setting price of gold, determined twice each business day on the London bullion market by the five members of The London Gold Market Fixing Ltd.
The MSCI ACWI (Morgan Stanley Capital International All Country World Index) is a stock index designed to track broad global equity-market performance. Maintained by Morgan Stanley Capital International (MSCI), the index captures large and mid cap representation across 23 Developed Markets (DM) and 24 Emerging Markets (EM) countries.
The MSCI EAFE® (Morgan Stanley Capital International Europe, Australasia, and the Far East) Index is a broad market index of stocks located within countries in Europe, Australasia, and the Middle East.
The MSCI (Morgan Stanley Capital International) Emerging Markets® Index is a selection of stocks that is designed to track the financial performance of key companies in fast-growing nations.
The MSCI (Morgan Stanley Capital International) US REIT Index is a free float-adjusted market capitalization weighted index that is comprised of equity Real Estate Investment Trusts (REITs). The index is based on the MSCI USA Investable Market Index (IMI), its parent index, which captures the large, mid and small cap segments of the USA market.
The Morningstar LSTA (Loan Syndications and Trading Association) US Leveraged Loan Index is designed to deliver comprehensive, precise coverage of the US leveraged loan market.
The Russell 2000® Index measures the performance of the 2,000 smaller companies that are included in the Russell 3000® Index, which itself is made up of nearly all U.S. stocks. The Russell 2000® is widely regarded as a bellwether of the U.S. economy because of its focus on smaller companies that focus on the U.S. market.
The Standard & Poor’s 500 (S&P 500) is a market-cap weighted index comprised of the common stocks of 500 leading companies in leading industries of the U.S. economy. You cannot invest directly in an index.
The S&P Global ex-U.S. Property Index is a free-float-adjusted, market-capitalization-weighted index that measures the equity market performance of international real estate stocks in both developed and emerging markets.
The American Association of Individual Investors (AAII) Sentiment Survey is a weekly poll (indicator) of its members’ opinion on where the market will be in six months, is often written about by financial bloggers and other personal investment organizations, who consider the survey to be among the best of contrarian indicators.
The Bureau of Labor Statistics (BLS) is an agency of the United States Department of Labor. It is the principal fact-finding agency in the broad field of labor economics and statistics and serves as part of the U.S. Federal Statistical System. BLS collects, calculates, analyzes, and publishes data essential to the public, employers, researchers, and government organizations.
Capitalization (Cap) is used to describe the size of the company, by market capitalization as follows:
- mega-cap: market value of $200 billion or more;
- large-cap: market value between $10 billion and $200 billion;
- mid-cap: market value between $2 billion and $10 billion;
- small-cap: market value between $250 million and $2 billion; and
- micro-cap: market value of less than $250 million
CNBC is an American business news television channel, formerly called Consumer News and Business Channel until 1991.
COVID (COrona VIrus Disease) is the new name of this disease is coronavirus disease 2019, abbreviated as COVID-19. In COVID-19, ‘CO’ stands for ‘corona,’ ‘VI’ for ‘virus,’ and ‘D’ for the disease. Formerly, this disease was referred to as “2019 novel coronavirus” or “2019-nCoV.”
The Conference Board Consumer Confidence Survey (CCS) is a monthly report that measures consumer attitudes and buying intentions, providing insights into the overall health of the U.S. economy from a consumer perspective.
The Federal Open Market Committee (FOMC) is the branch of the Federal Reserve System that determines the direction of monetary policy. The FOMC has 12 voting members, including all seven members of the Board of Governors and a rotating group of five Reserve Bank presidents. The Chair of the Board of Governors also serves as Chair of the FOMC.
FRED (Federal Reserve Economic Data) is an online database consisting of hundreds of thousands of economic data time series from scores of national, international, public, and private sources.
Gross domestic product (GDP) is the total monetary or market value of all the finished goods and services produced within a country’s borders in a specific time period. As a broad measure of overall domestic production, it functions as a comprehensive scorecard of a given country’s economic health.
GDPNow is a model from the Federal Reserve Bank of Atlanta that forecasts the growth of gross domestic product (GDP). It is based on a methodology similar to the one used by the U.S. Bureau of Economic Analysis (BEA). It complements the BEA’s quarterly GDP release.
The Harvard CAPS (Center for American Political Studies) / Harris Poll is conducted by The Harris Poll & HarrisX online within the United States every month and captures the responses of over 2,000 registered voters. The results reflect a nationally representative sample.
A real estate investment trust (REIT) is a company that owns, operates, or finances income-generating real estate.
The U.S. Agency for International Development (USAID) is an independent agency of the United States government responsible for administering civilian foreign aid and development assistance, focusing on areas like disaster recovery, poverty reduction, and democratic reforms.
